
Creating Measurements#
While sometimes, the goal of an experiment is just to find objects or to classify images and/or objects, other times, we want to go deeper and learn more about the images and/or objects we care about. This is where Measurements come in.
Right now, Piximi supports two broad classes of measurements - intensity measurements, which work for images OR objects, and shape/geometry measurements, which work for objects alone. More categories of measurements will be rolling out in time - stay tuned!
Measurements are available from the Measure button in the top bar of the Project Viewer.
Measurements are created in individual tables - each table is specific to one “kind” - either images or a type of segmented object (such as cells). You can create as many tables as you like. Each table can break its measurements down by Split Options - essentially, what are the different conditions in this experiment (if any) and how should we parse them? Each table has its own split options, which you can adjust at any time.
This page walks through the steps. For a description of every control, see the Measurements Viewer page. The screenshots use the Translocation Tutorial project after its cells have been segmented (see the Translocation Tutorial), so the object kind measured here is cellpose_cells, but the steps are the same for any project.
Create Measurements in Piximi#
Click
Measurein the top bar of the Project Viewer. It opens the Measurements view for the whole project, so you do not need to select anything first.
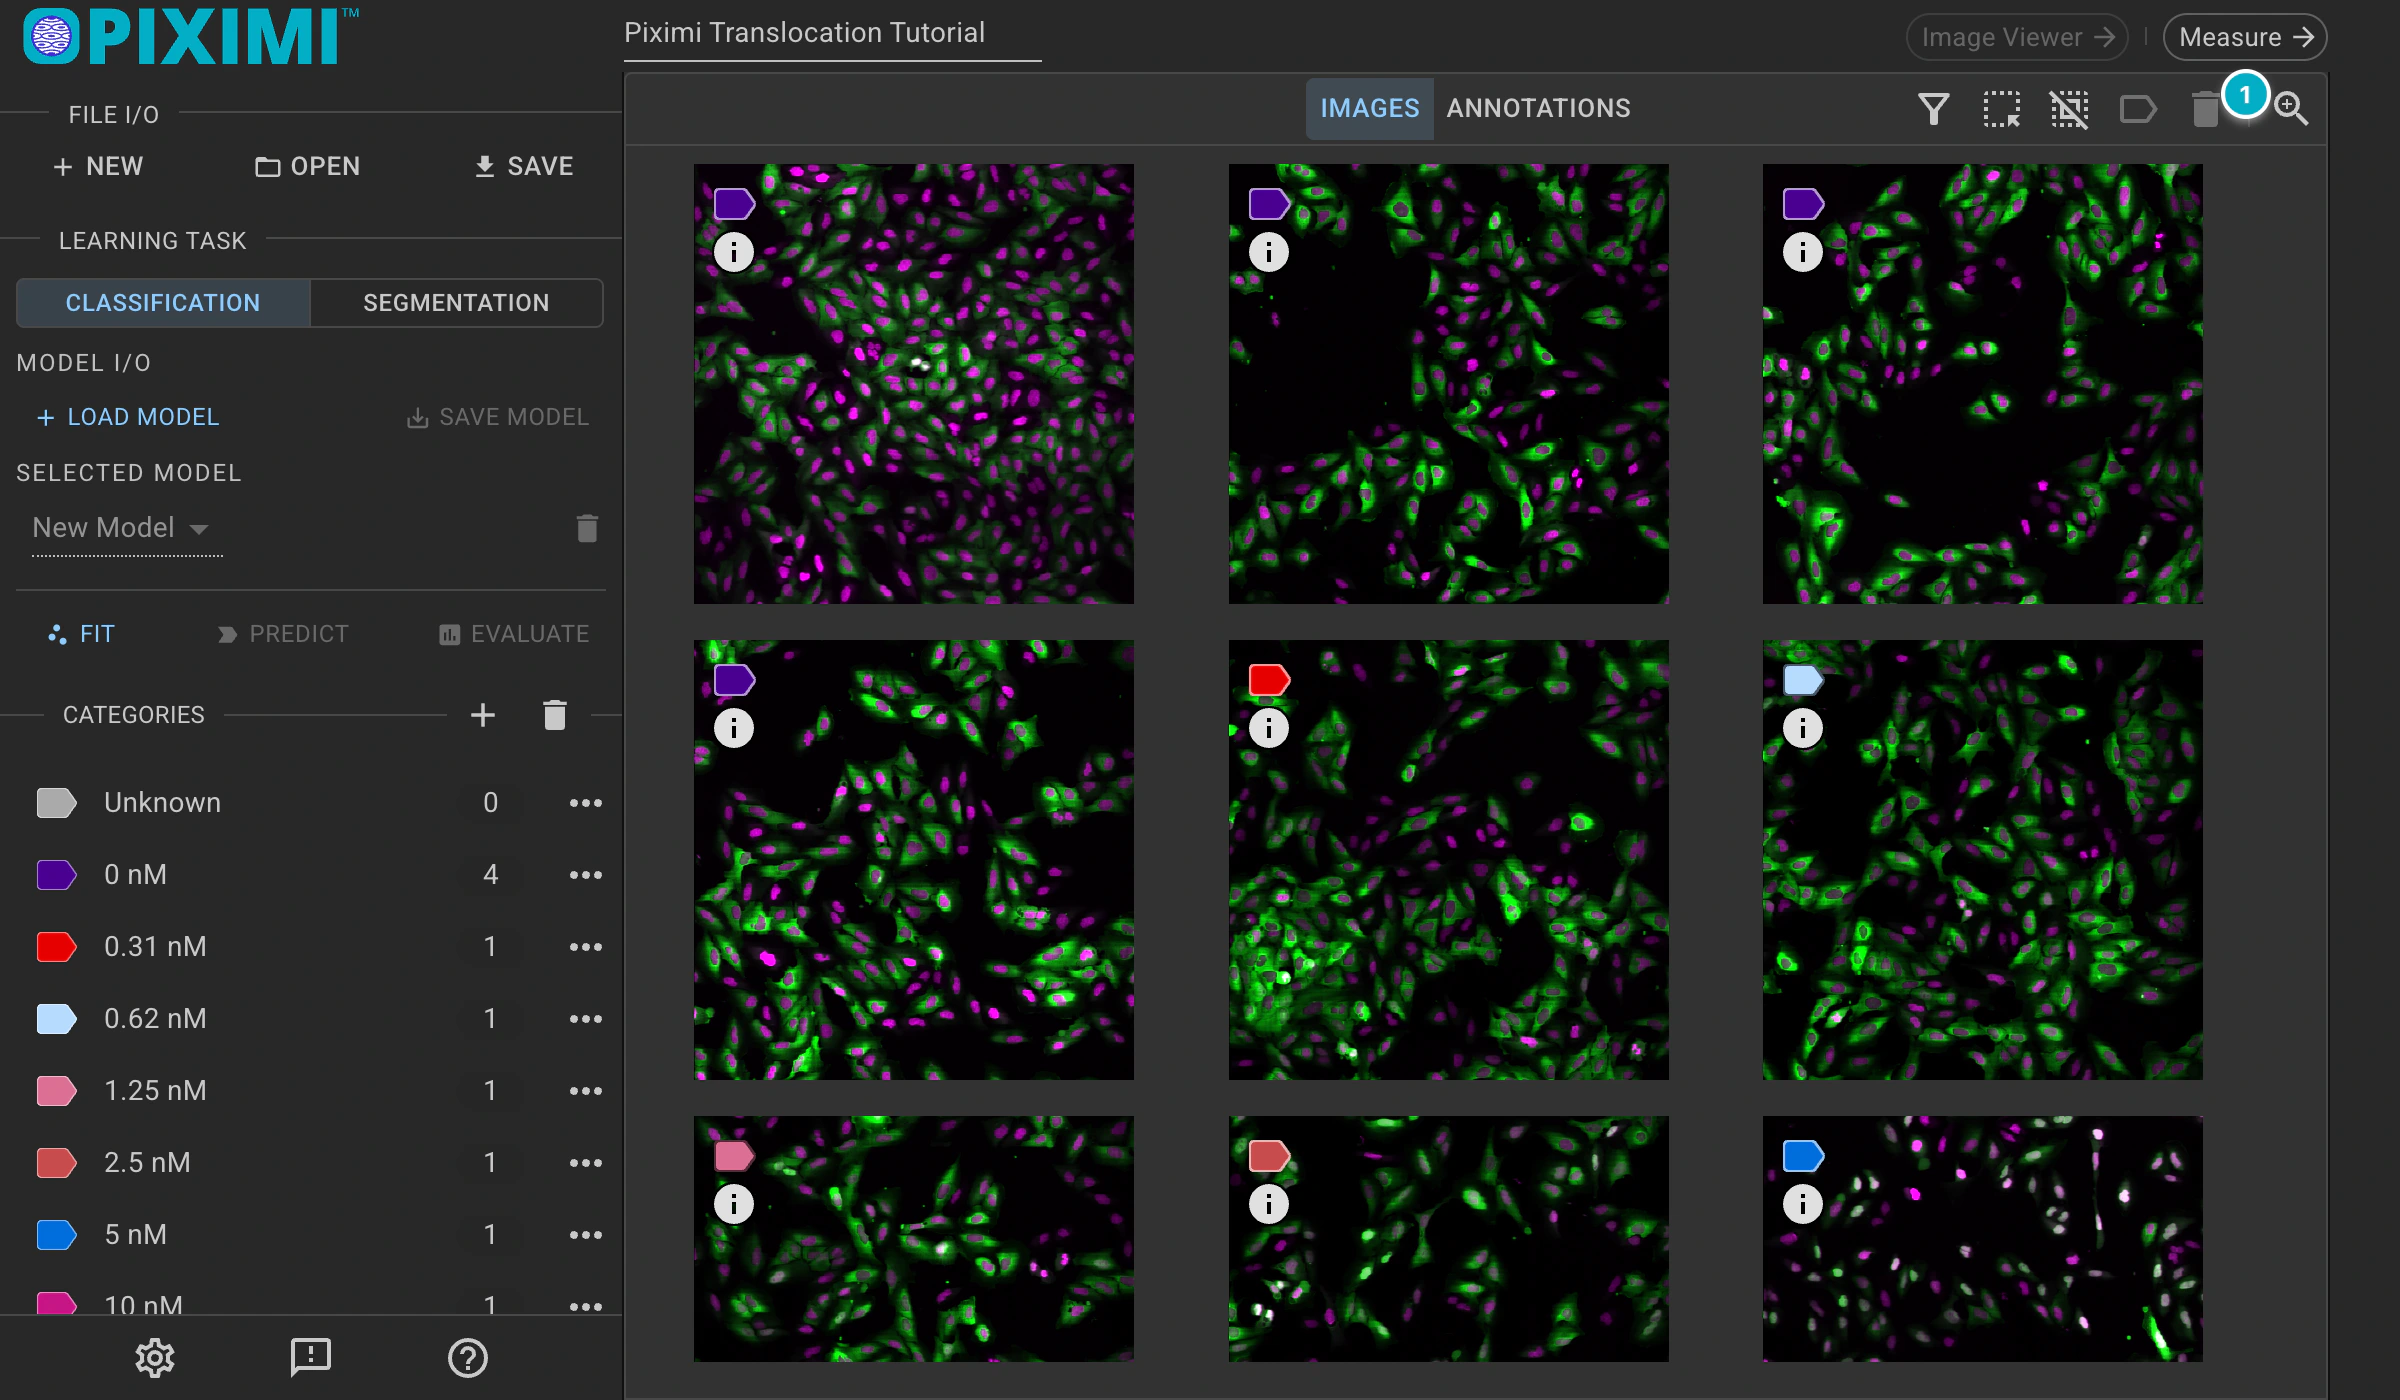
The Measure button in the Project Viewer.
Click
Add Tableto create a new measurement table. You can make as many tables as you like, to express different images or objects, broken down by different subsets.
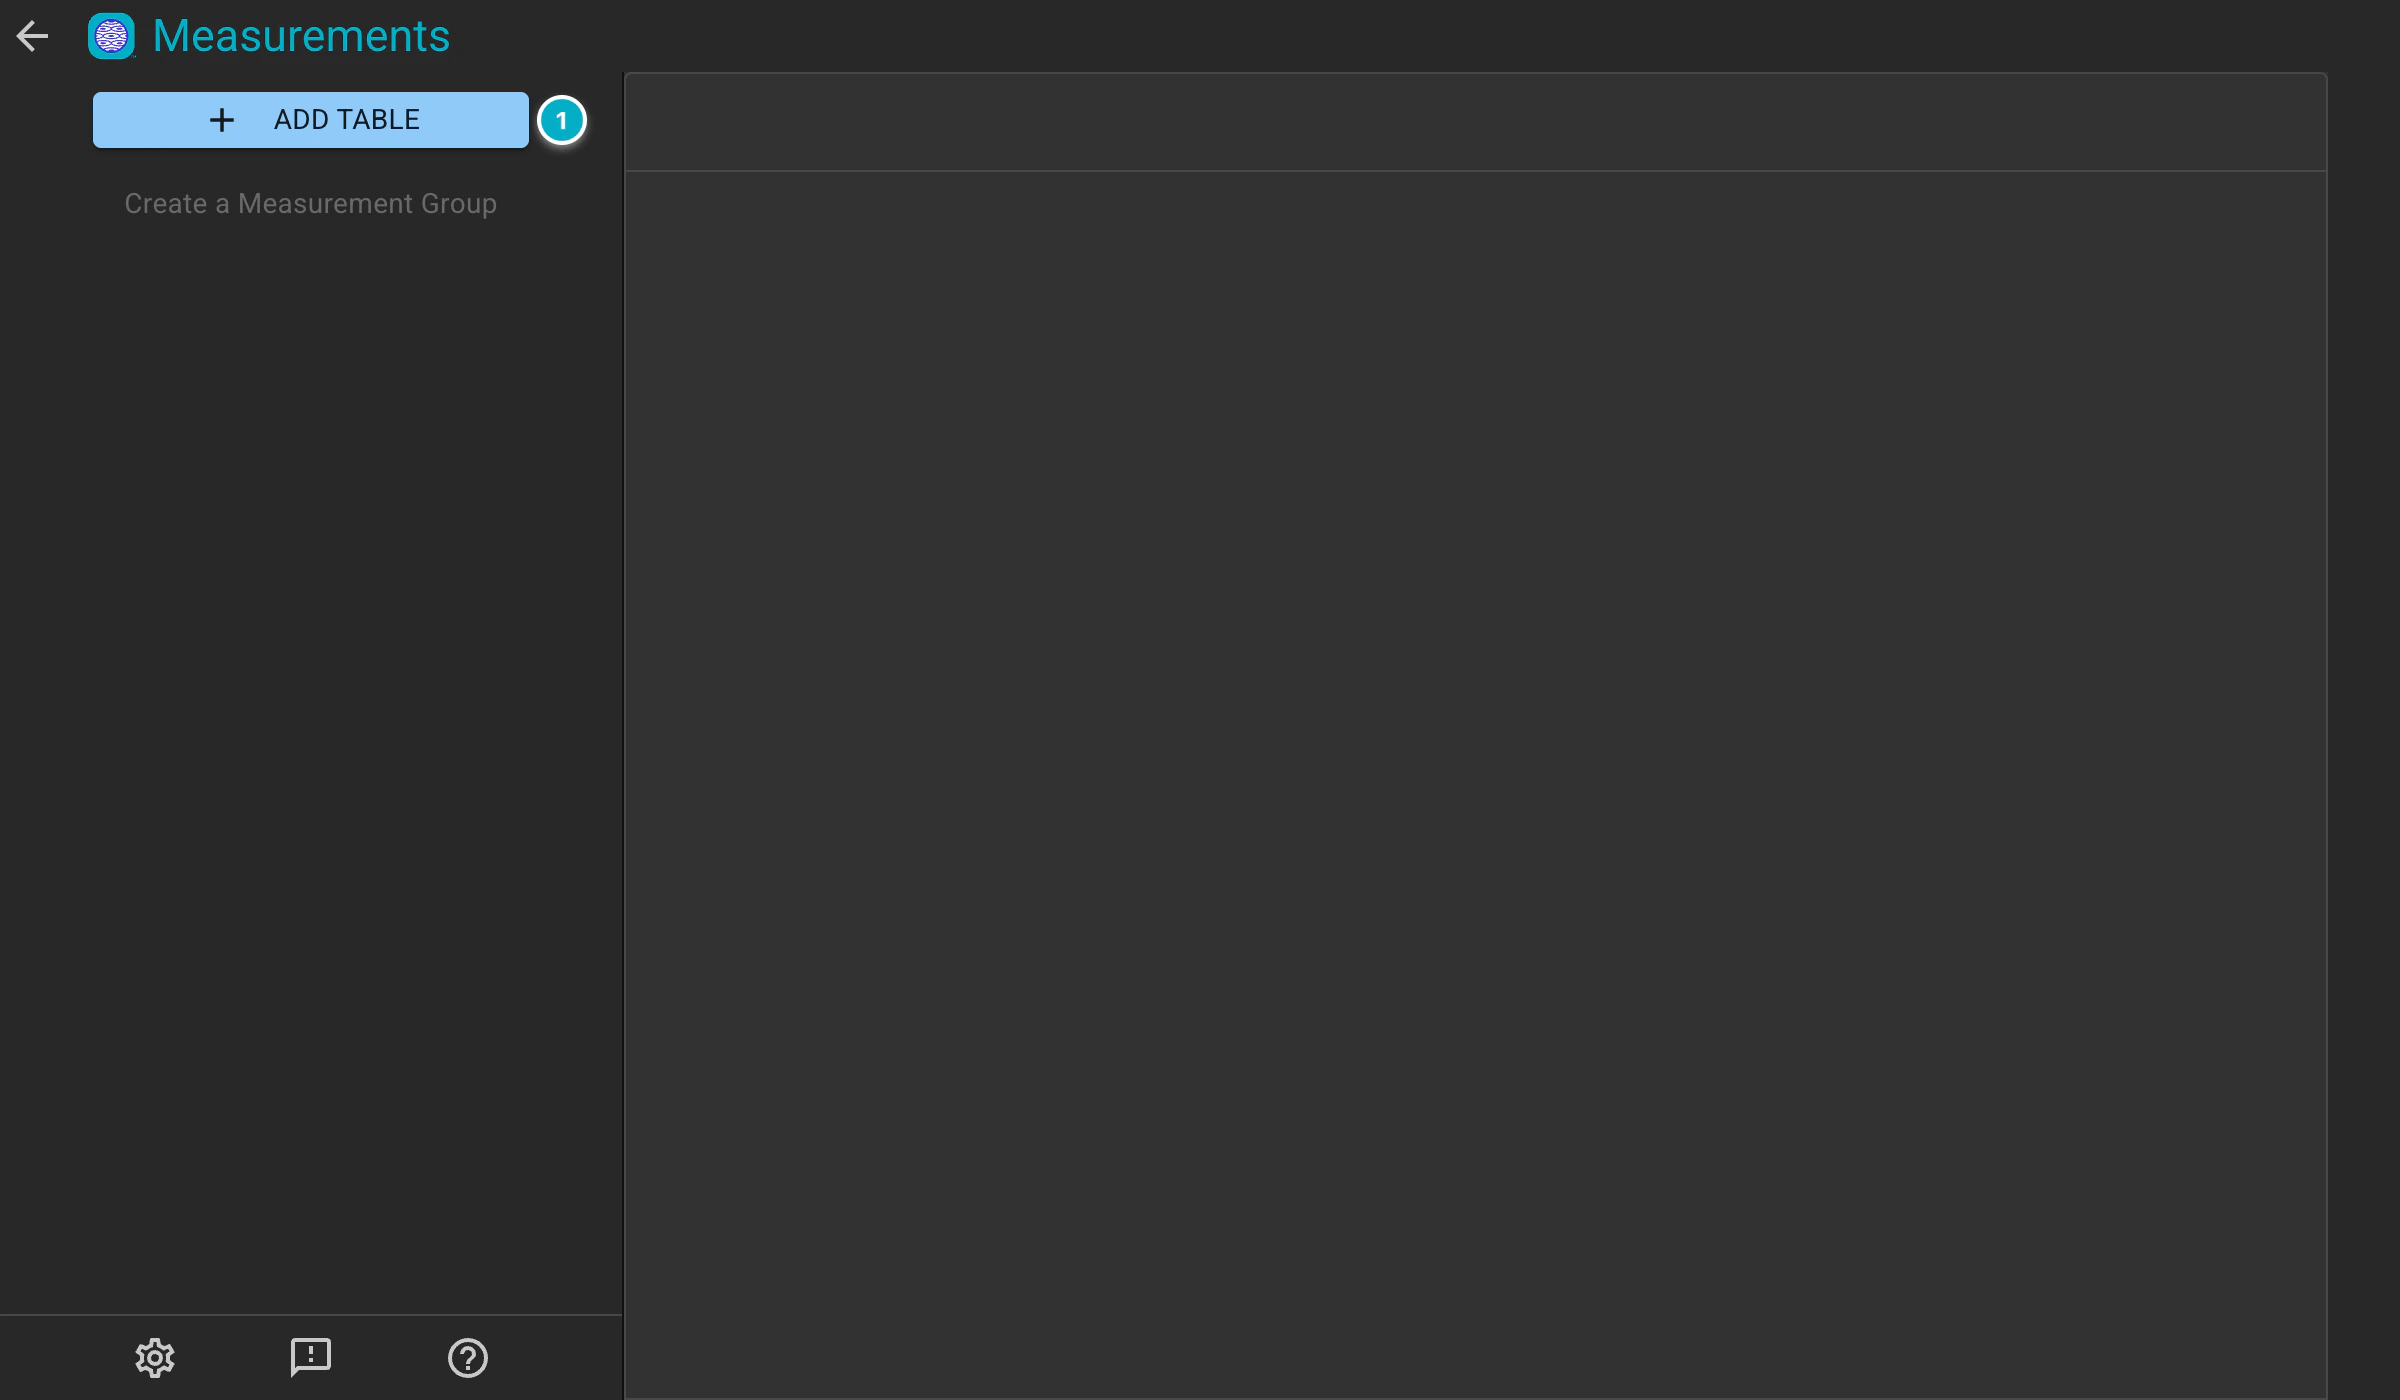
The Add Table button creates a new measurement table.
In the
Create Measurement Tablewindow, select thekindyou’d like to make measurements of and clickConfirm. Reminder,kinds include the images, as well as any objects you created via segmentation or annotation.
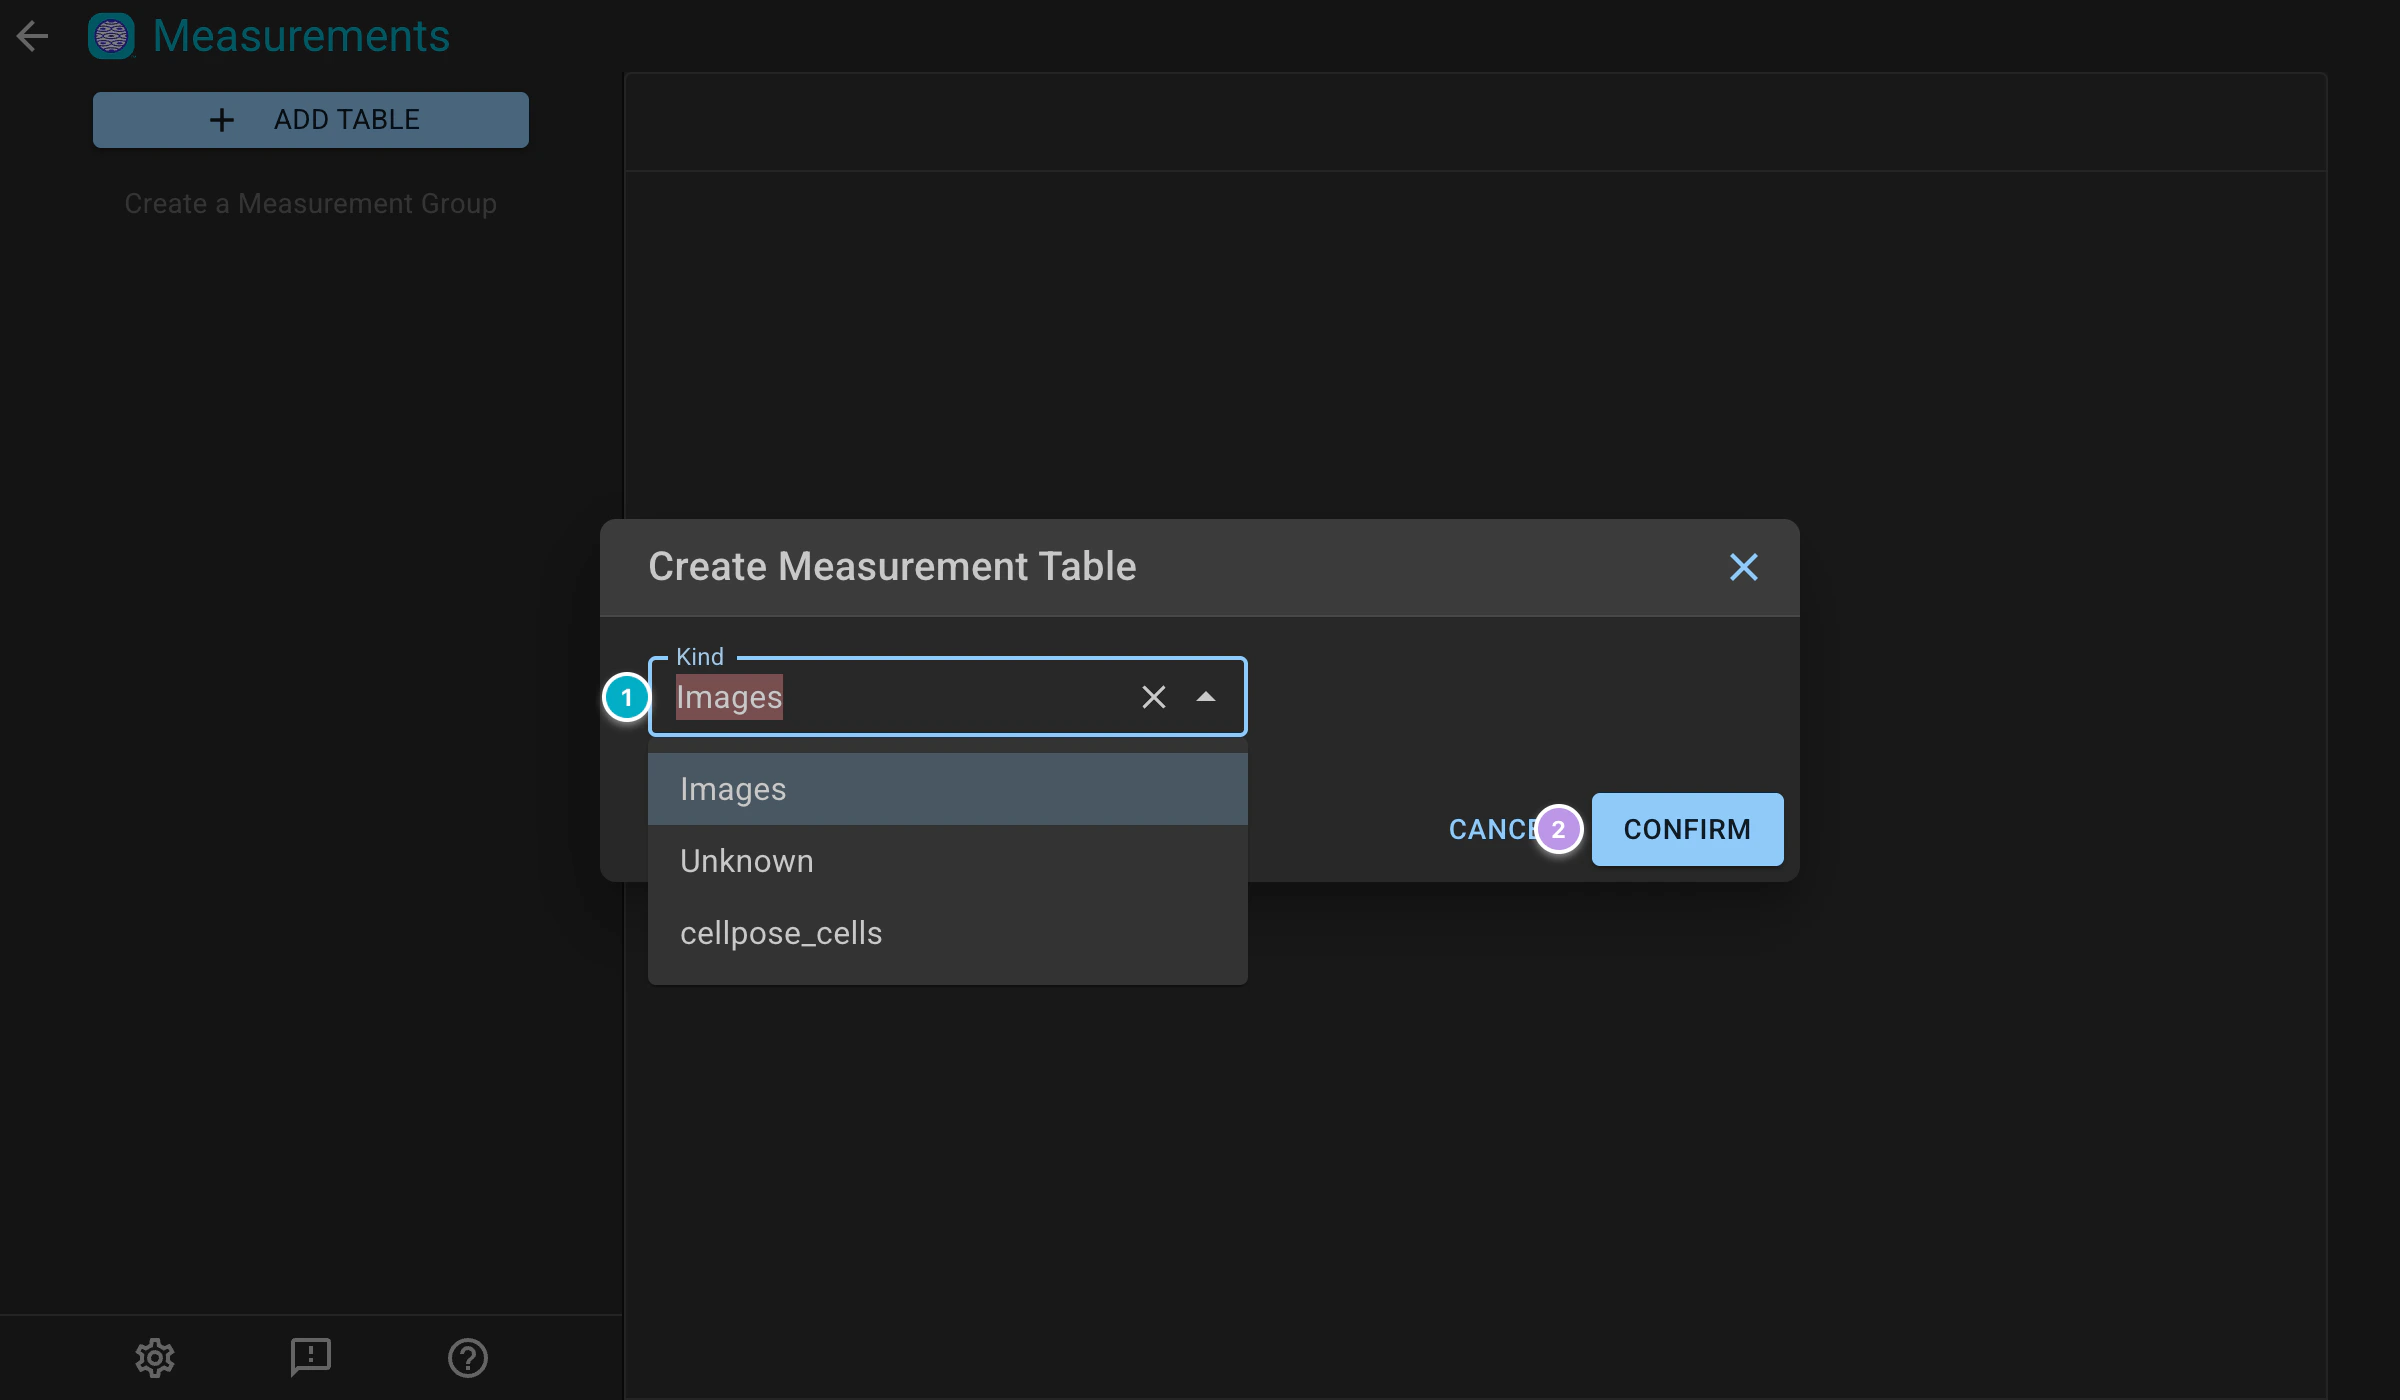
Select what kind of measurement table you’d like to make.
Piximi will begin to calculate metrics in the background. Depending on the number of examples present in that
kind, this may take a few minutes - an indicator next toTableswill show you the progress made. Make sure to keep the Piximi window open (consider moving it into its own tab) to let calculations continue!Once the initial pre-calculations are done, you can select which measurements you’d like to make in the left panel. Tick a group (
Objectmeasurements orIntensitymeasurements) to select all of its measurements, or expand it to pick individual ones. As before, this may take some time, so just leave the Piximi tab open and the circular indicator will let you know how long this is going to take. Object measurements are not available for theImageskind.
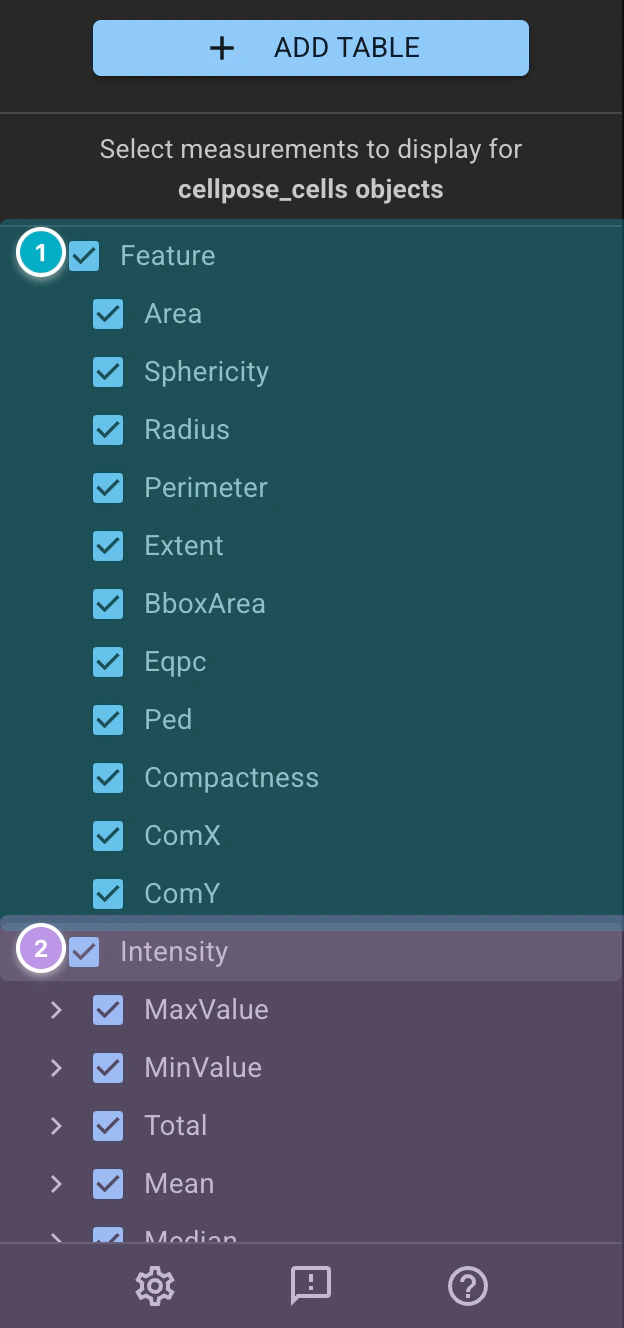
Select the measurements you want for this table. Just like during table creation, a circular indicator next to the word Measurements will tell you how far along Piximi is at generating them.
Once your measurements have been generated, they will appear in the main area in a data grid! In the grid, you can see the measurement name and the Count, Mean, Median, and Standard deviation of the data for that measurement. By default these are computed over every item of the kind. To break them down further, drag a dimension (
Category,PartitionorImage) fromAvailable DimensionsintoColumn GroupingunderSplit Options; the grid then shows one set of columns for each value (for example, each category). If you only have one category, that’s fine - splitting is optional.
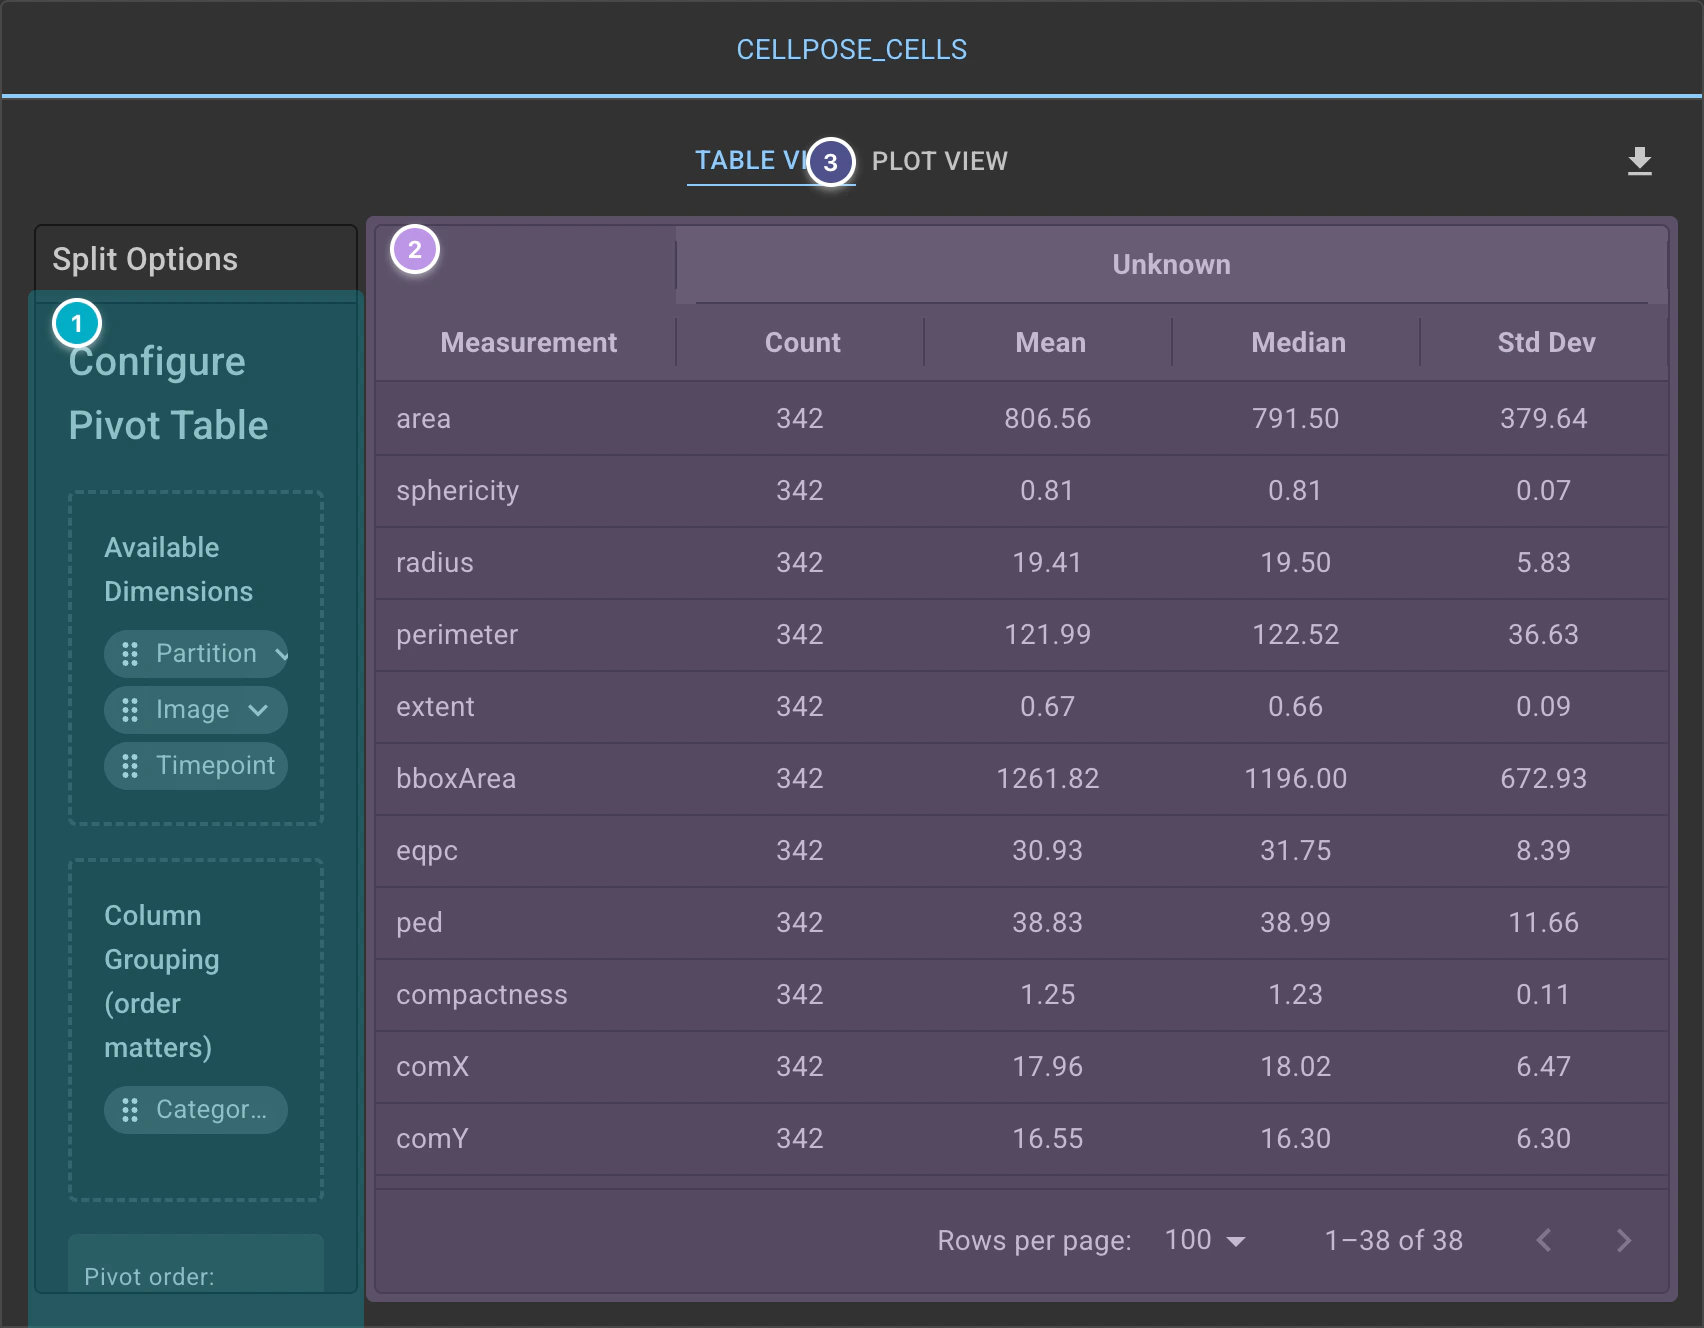
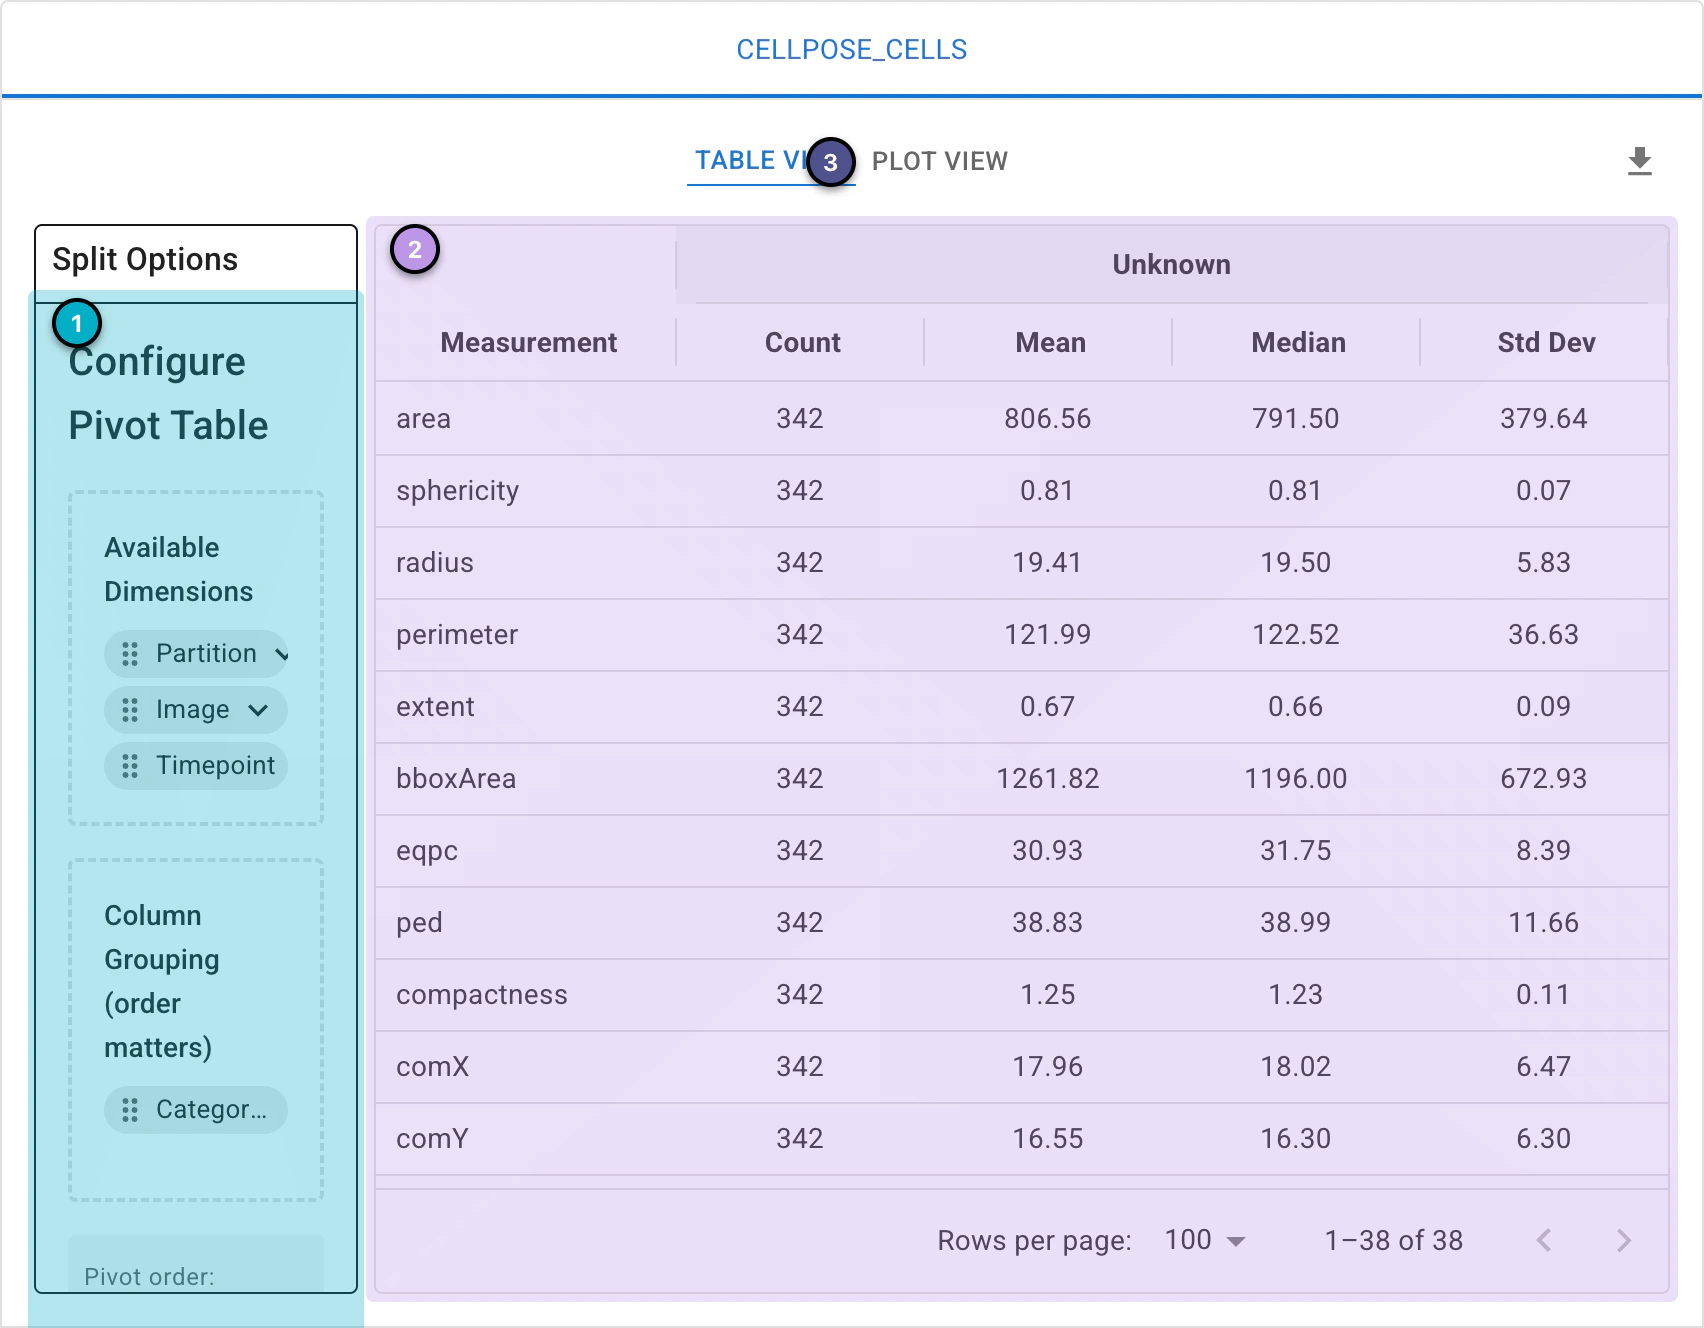
The Piximi data grid, split by category.
If you’d like to plot data in Piximi, simply navigate to the data grid containing the data you want to plot and click
Plot Viewabove the table. You can make as many plots as you would like by clicking the+at the end of the plot tabs. Plots can also be exported by saving to PNG. Piximi includes several plot types, including scatter plots, swarm plots, and histograms; choose one with thePlotmenu.
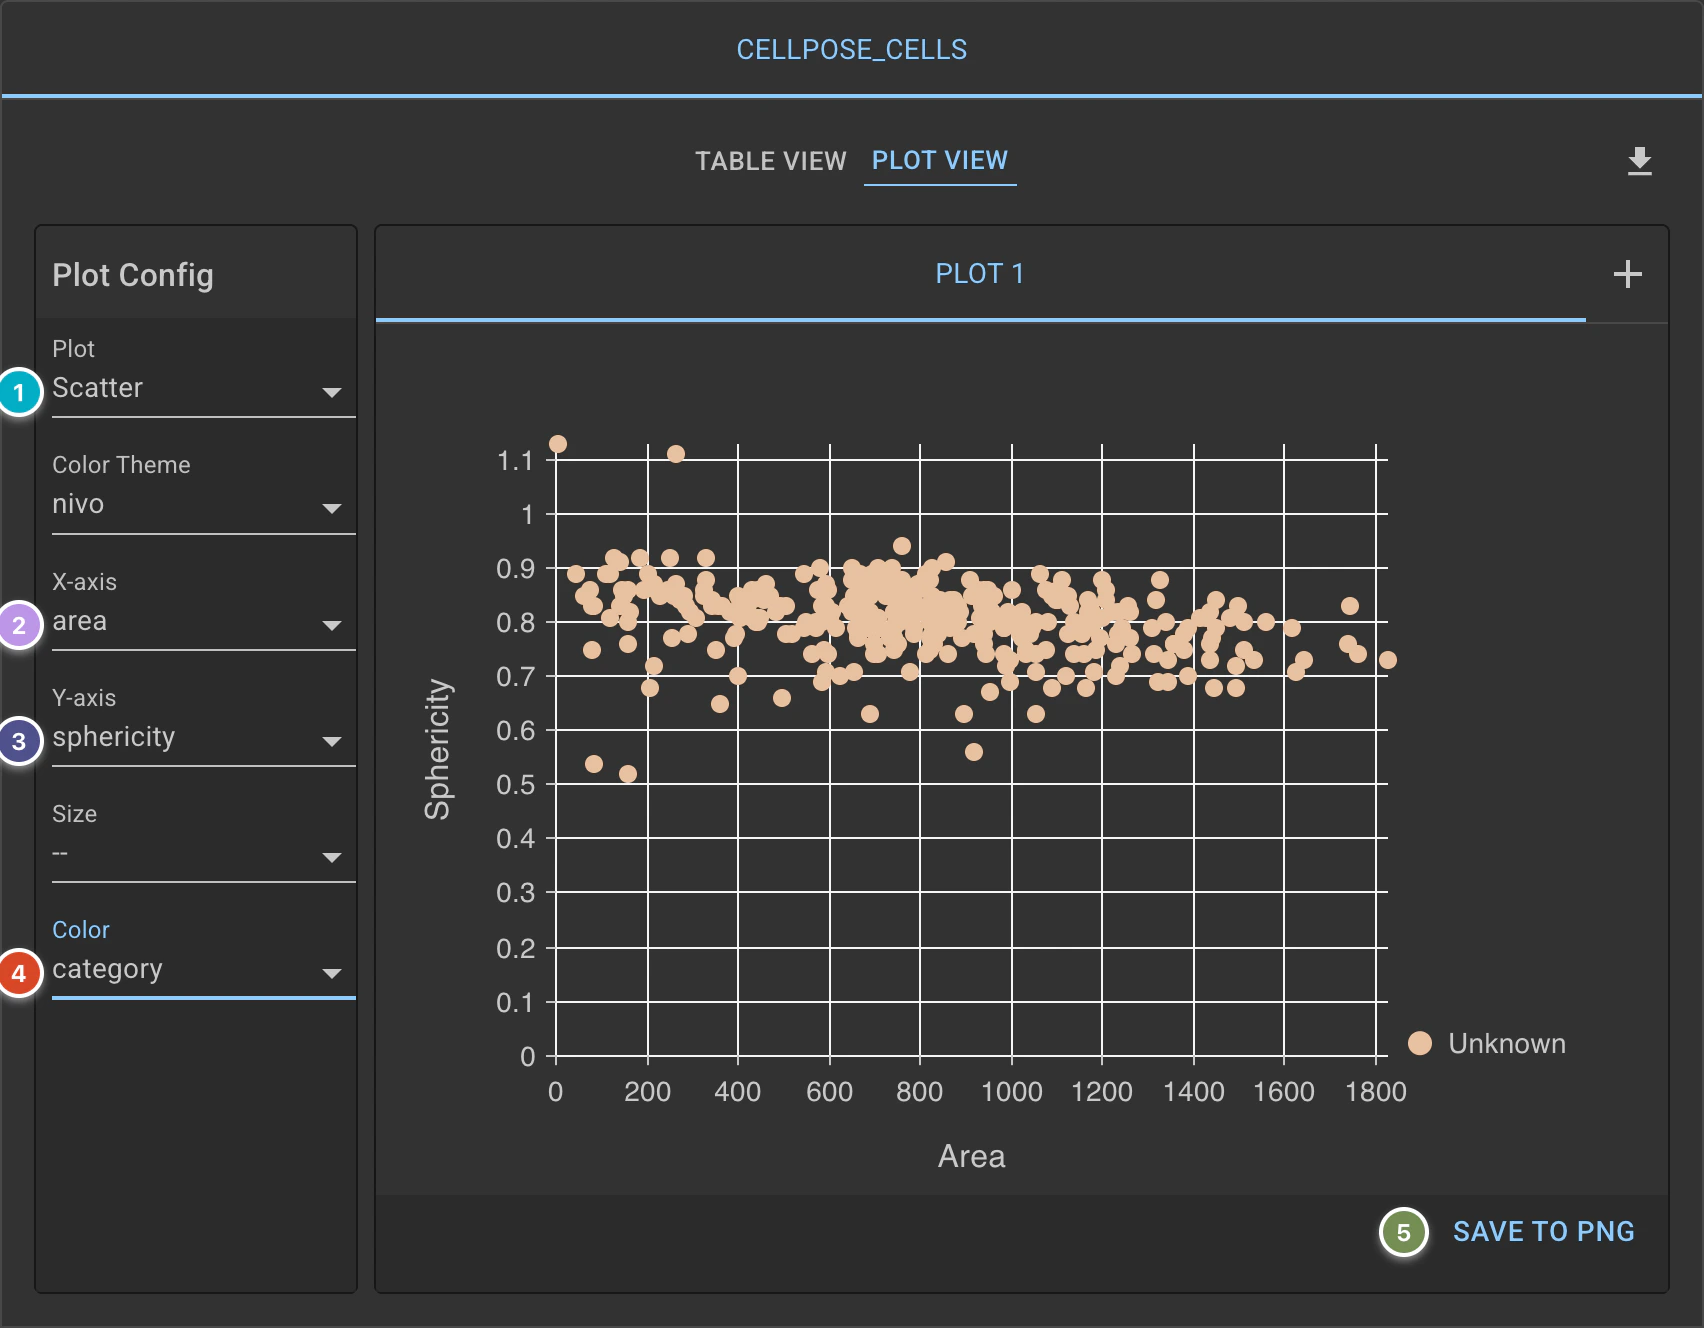
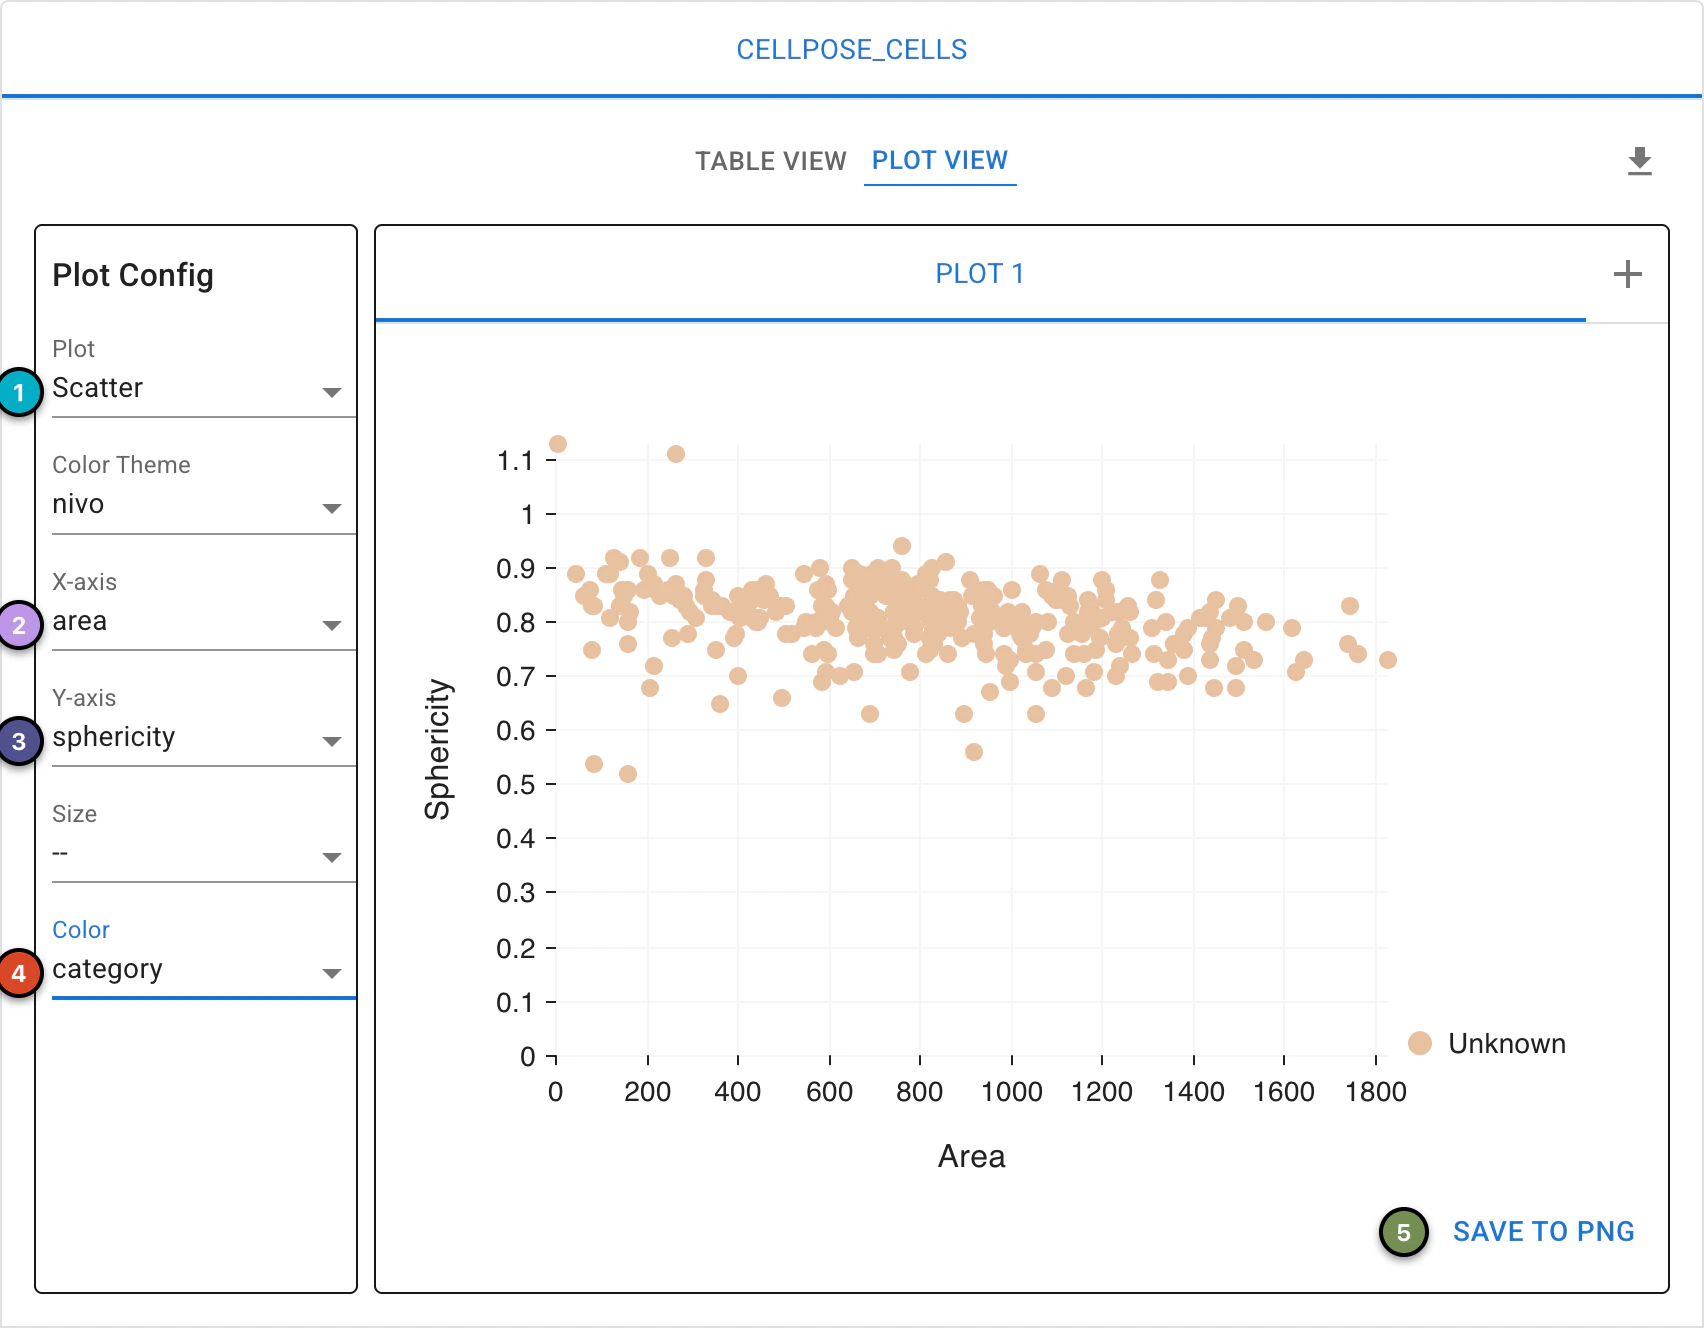
Scatter plots generated in Piximi can have X-axis, Y-axis and Size measurements selected; they can also show colors according to the selected split (Color), with many color themes to choose from. Note the button to save the plot as a PNG!
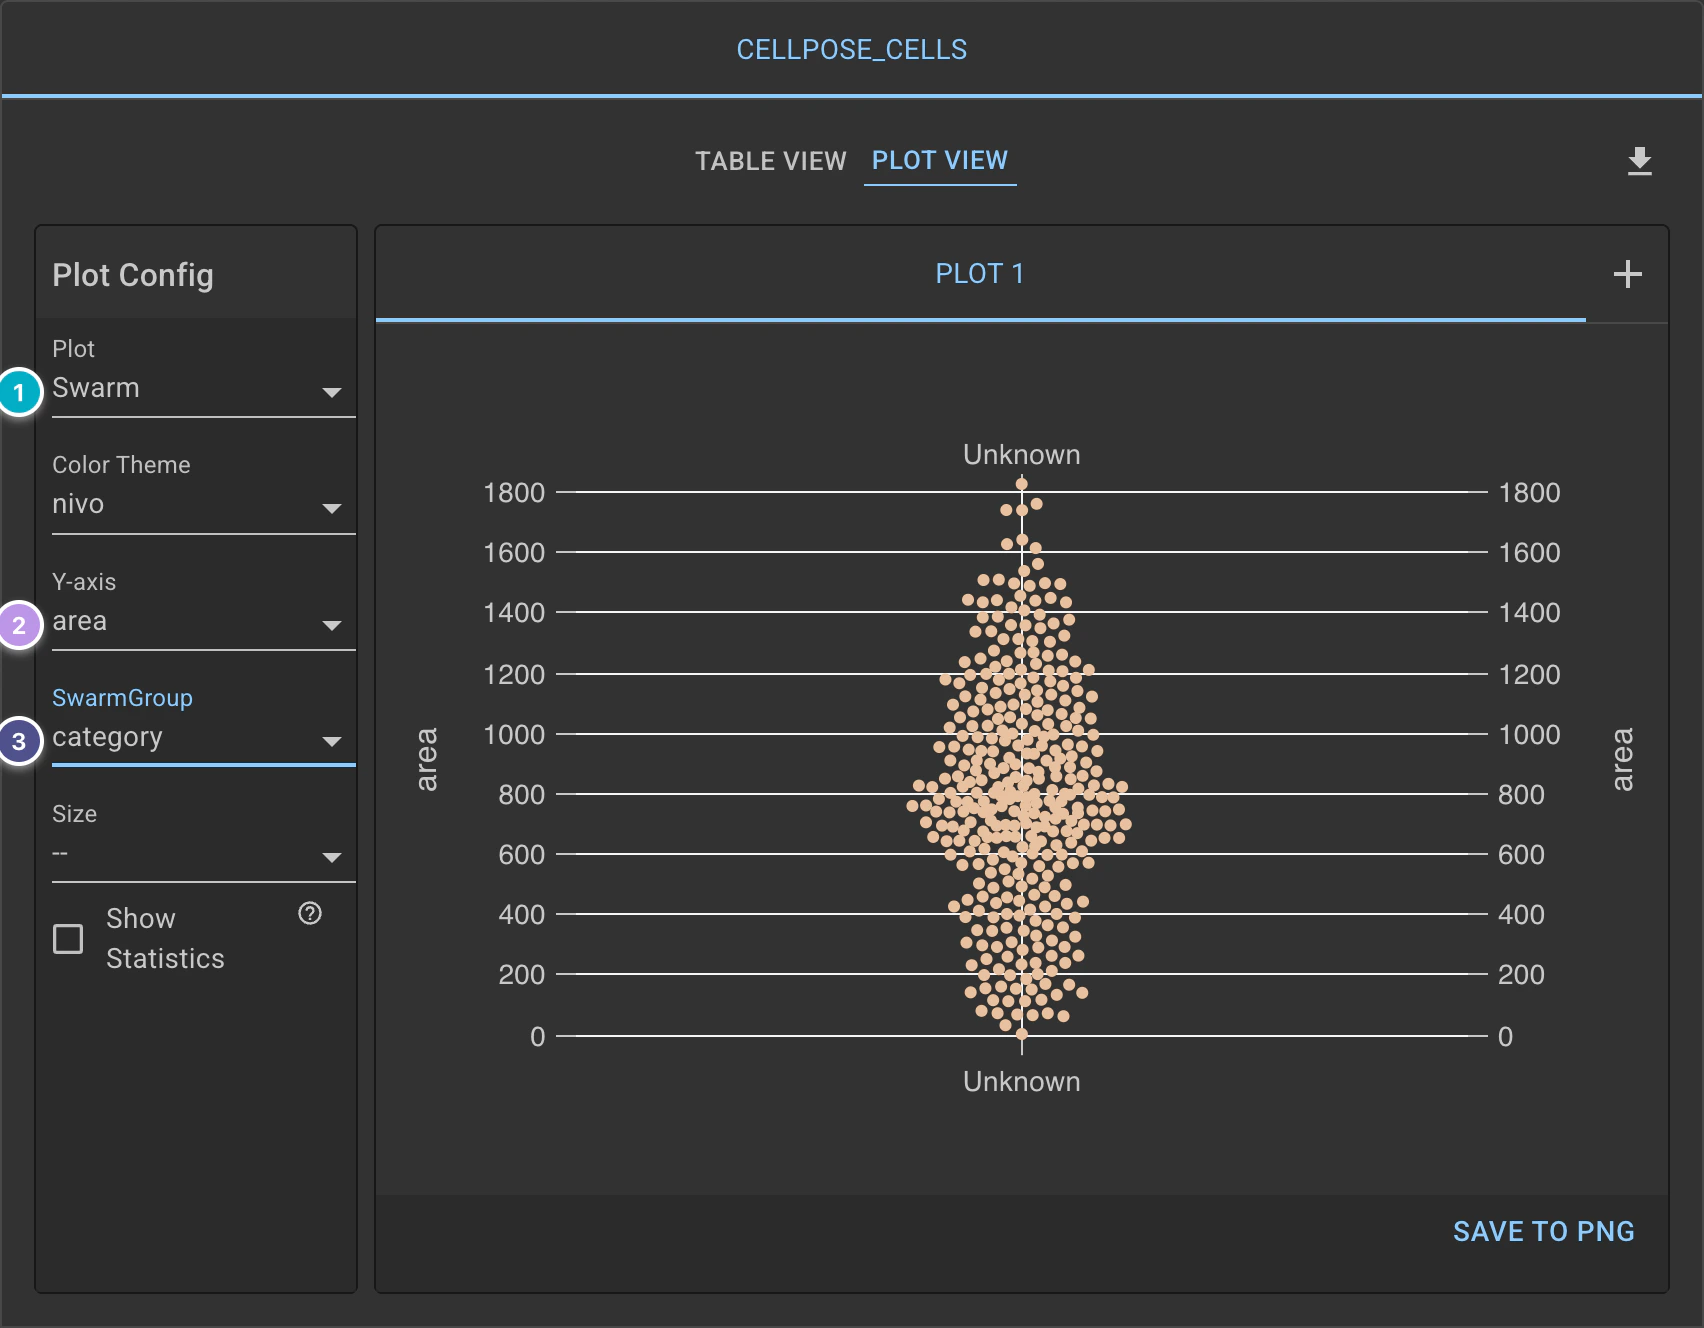
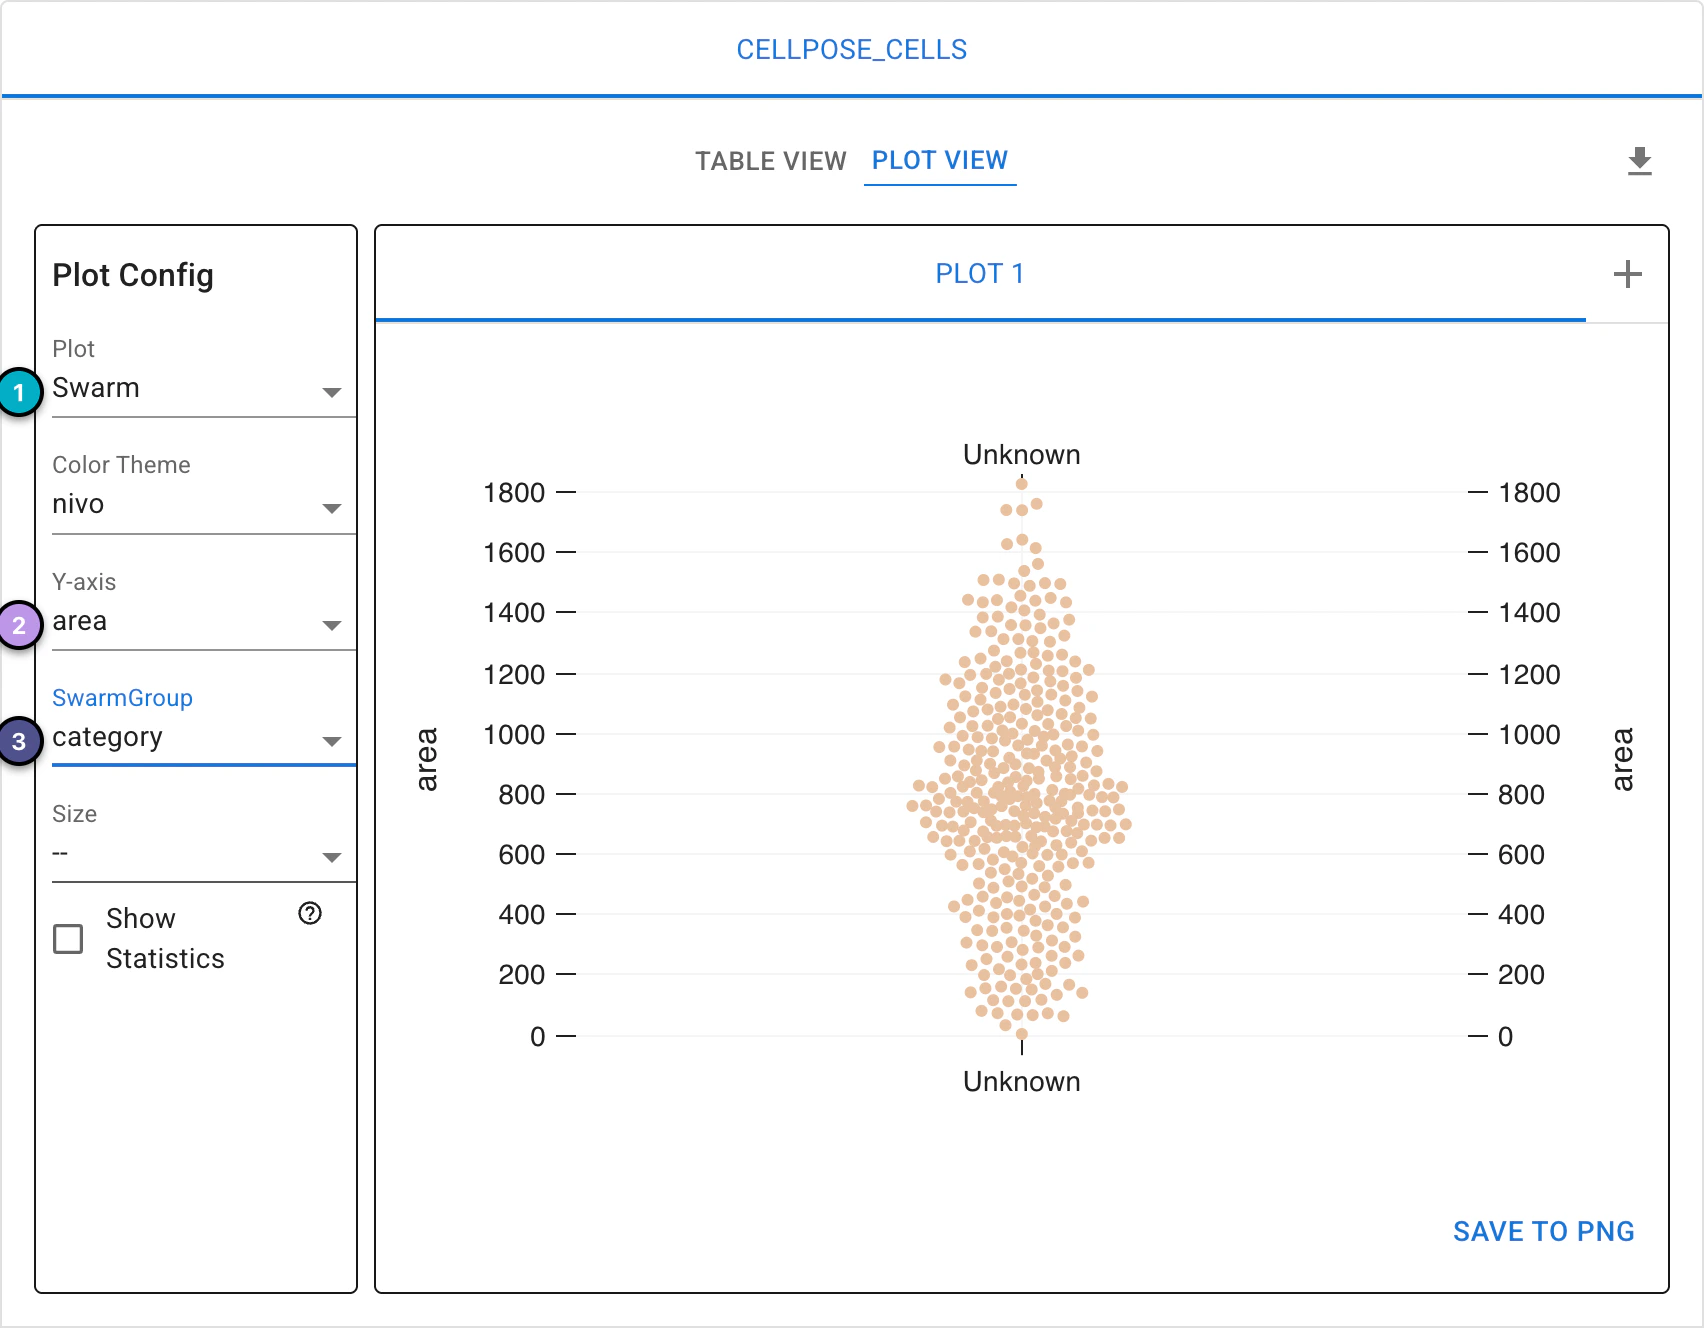
Swarm plots can be shown on their own, grouped by the split chosen in SwarmGroup…
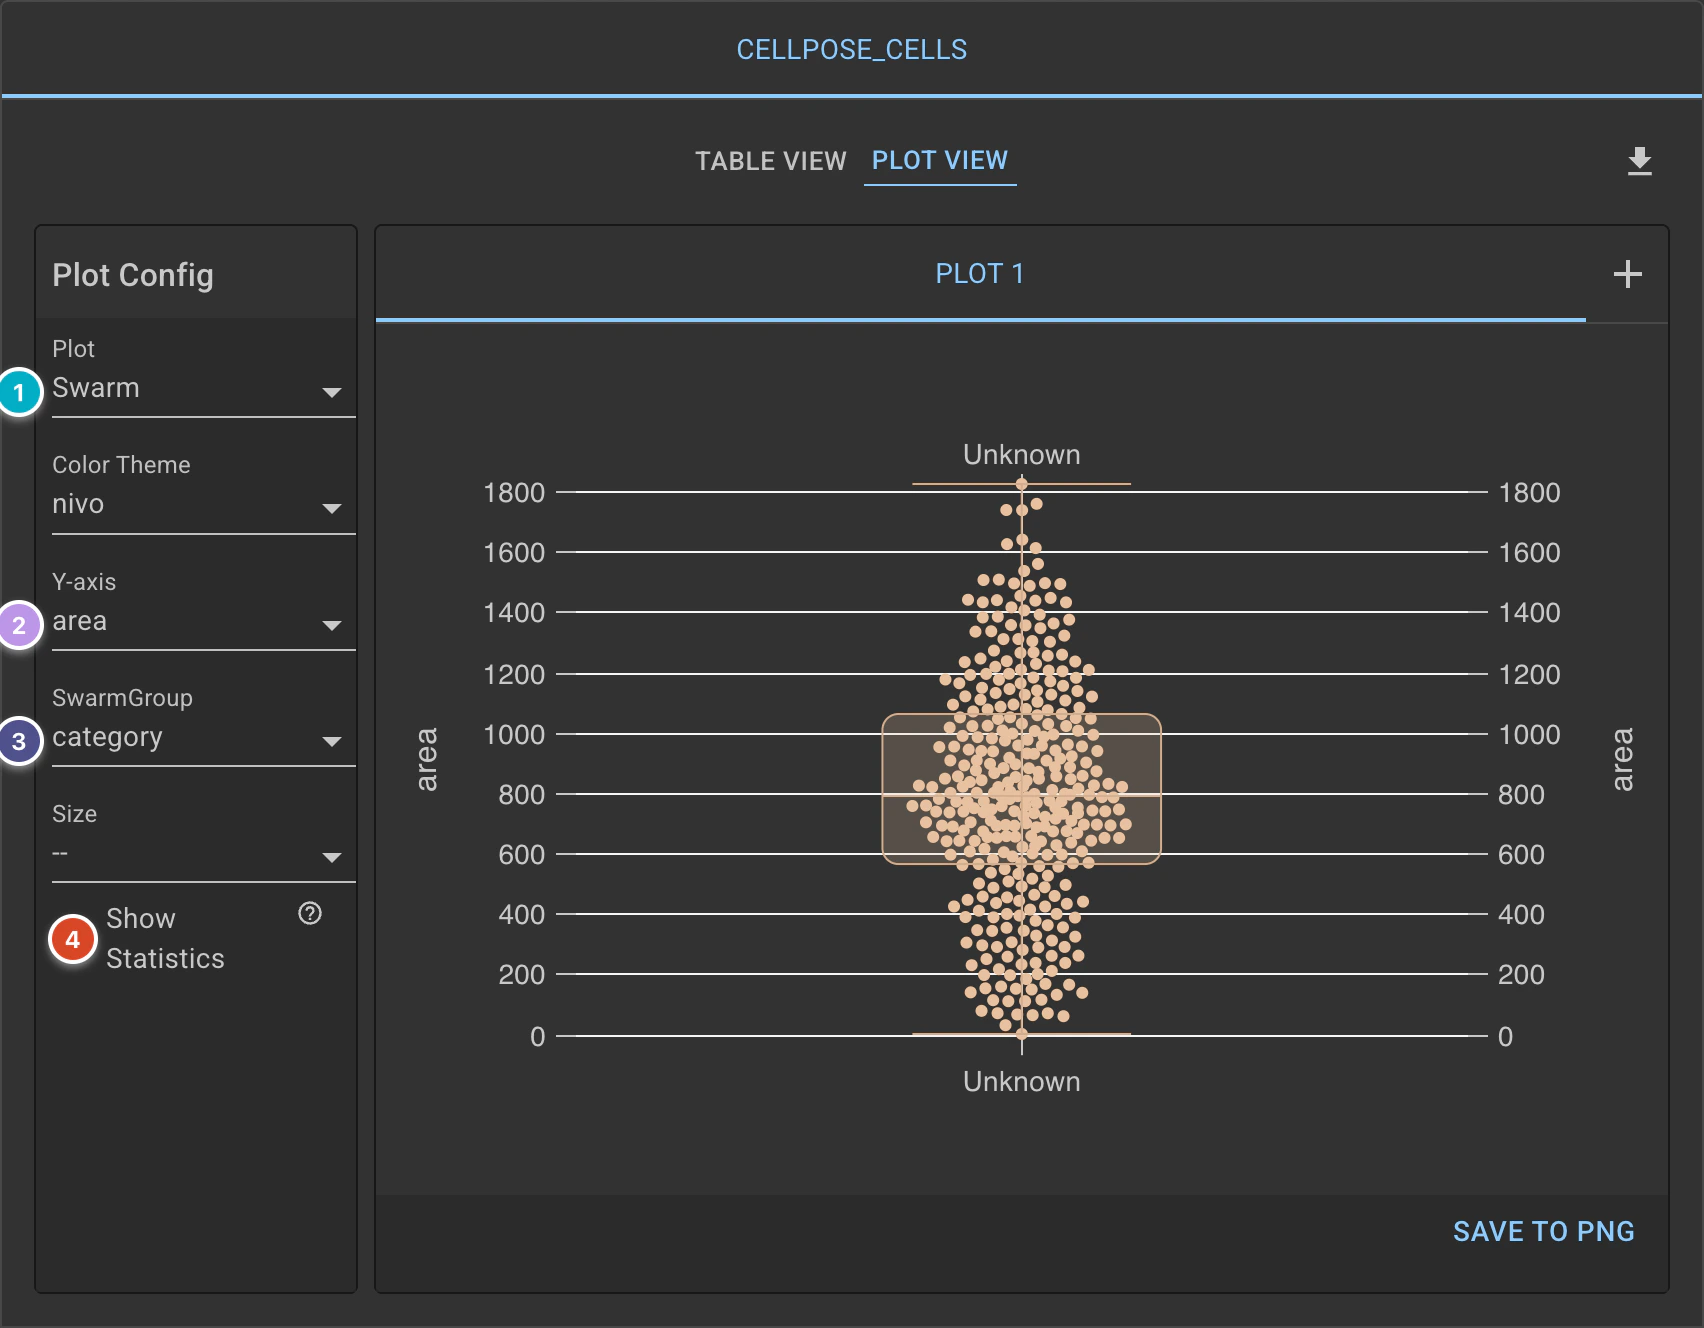
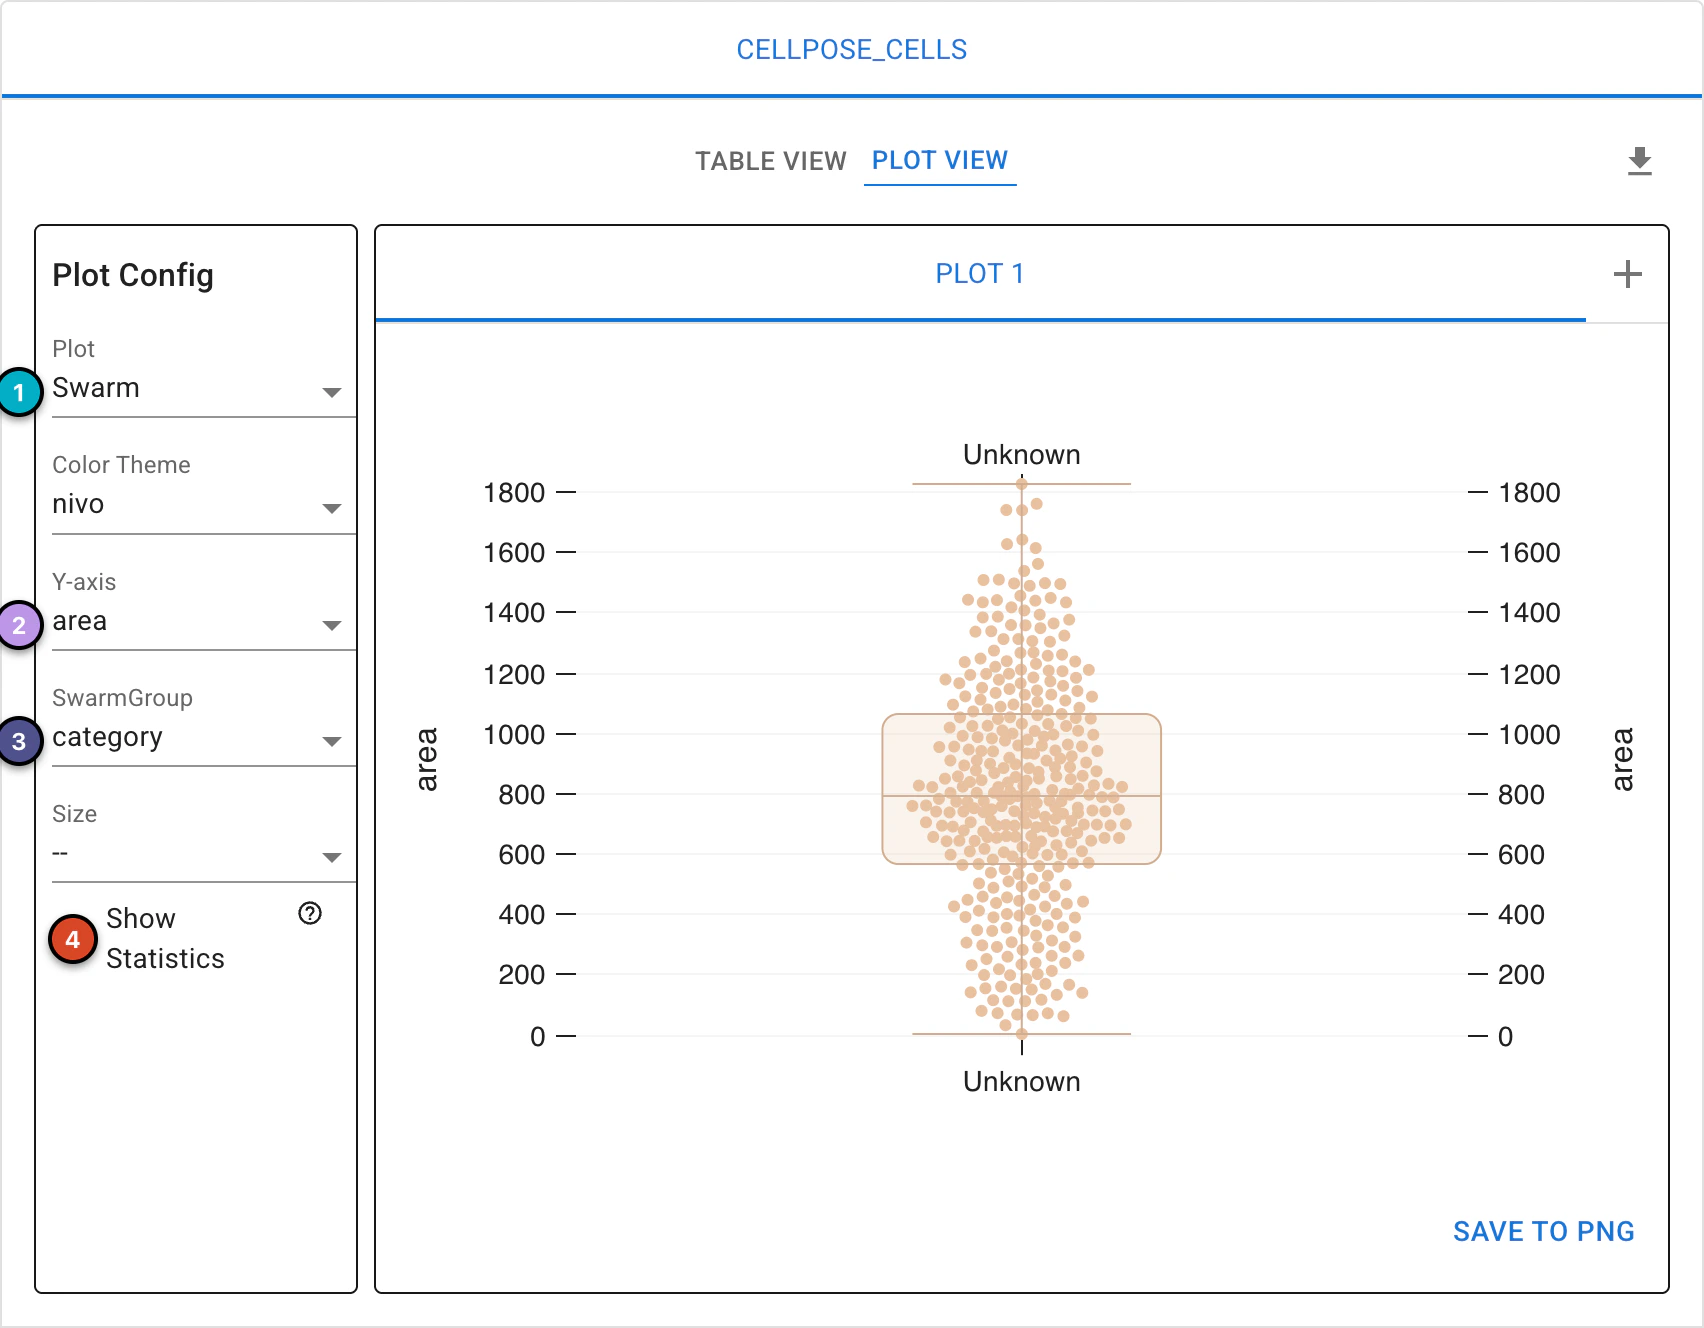
… or with a summary box plot overlaid by ticking Show Statistics.
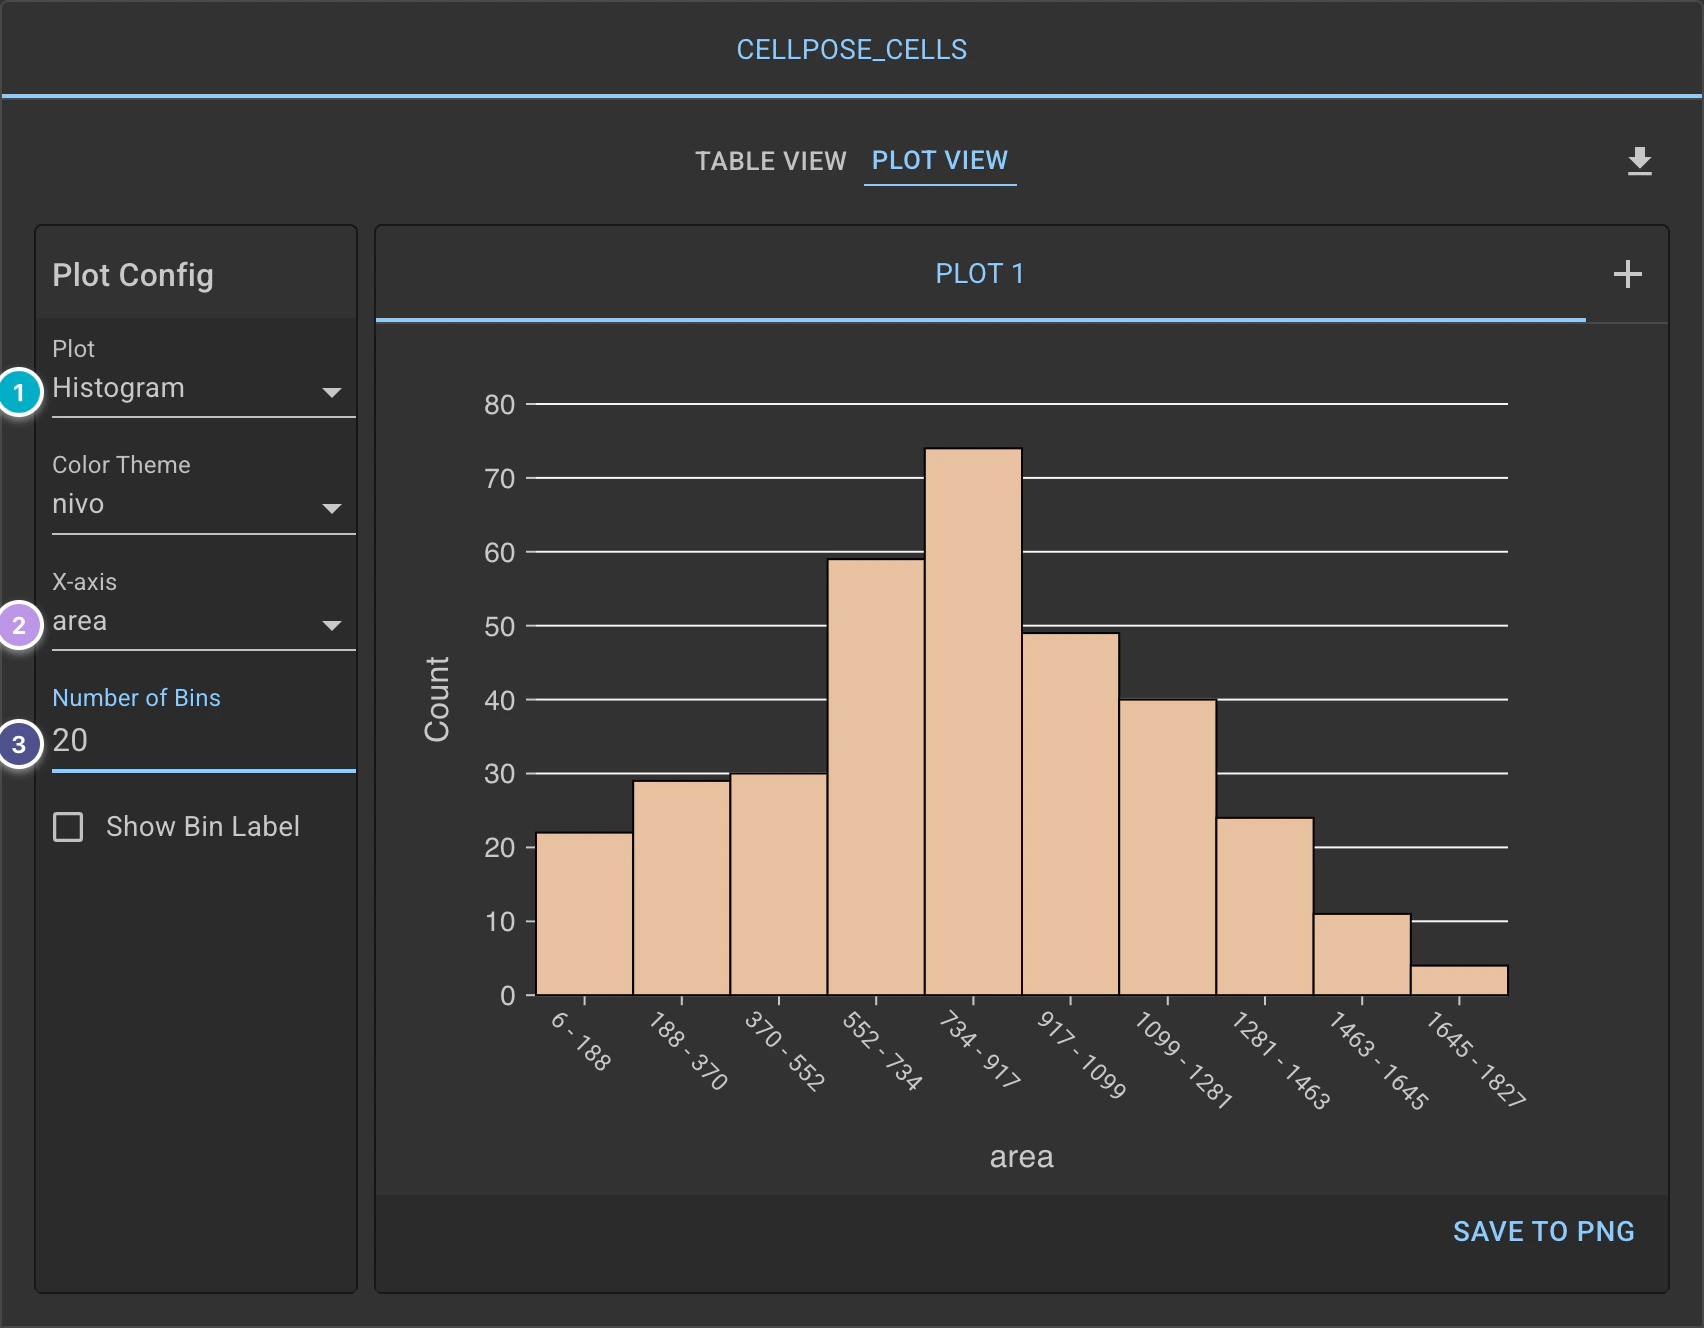
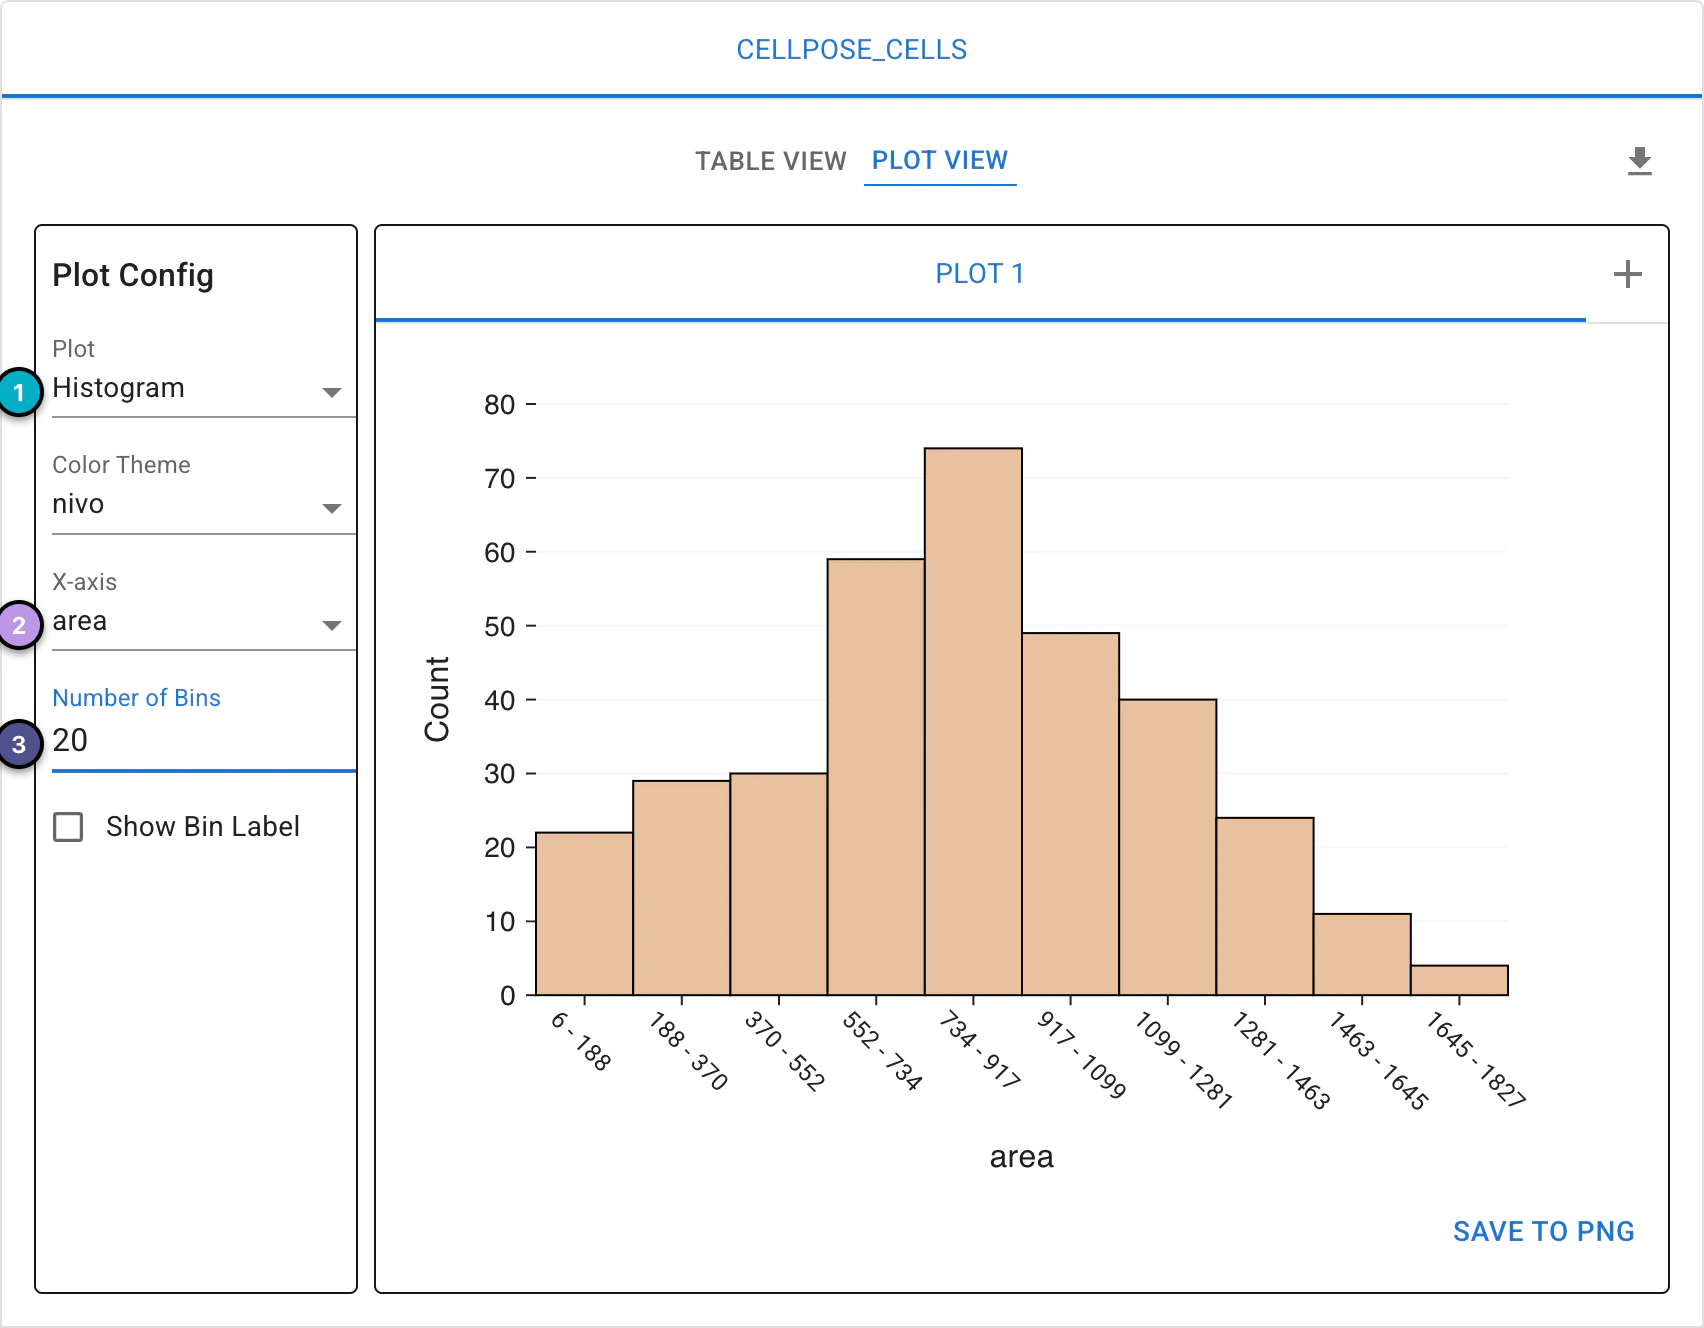
You can choose to represent your data as a histogram, with a custom number of bins.
If you want to do further analyses of your data (and you should)!, you can export your data tables with the download icon above the table - this will let you do whatever downstream analysis you like. Choose Statistics to export the grid as it is shown, Individual to export the measurements of the individual images or objects, or Statistics & Individual to export both.
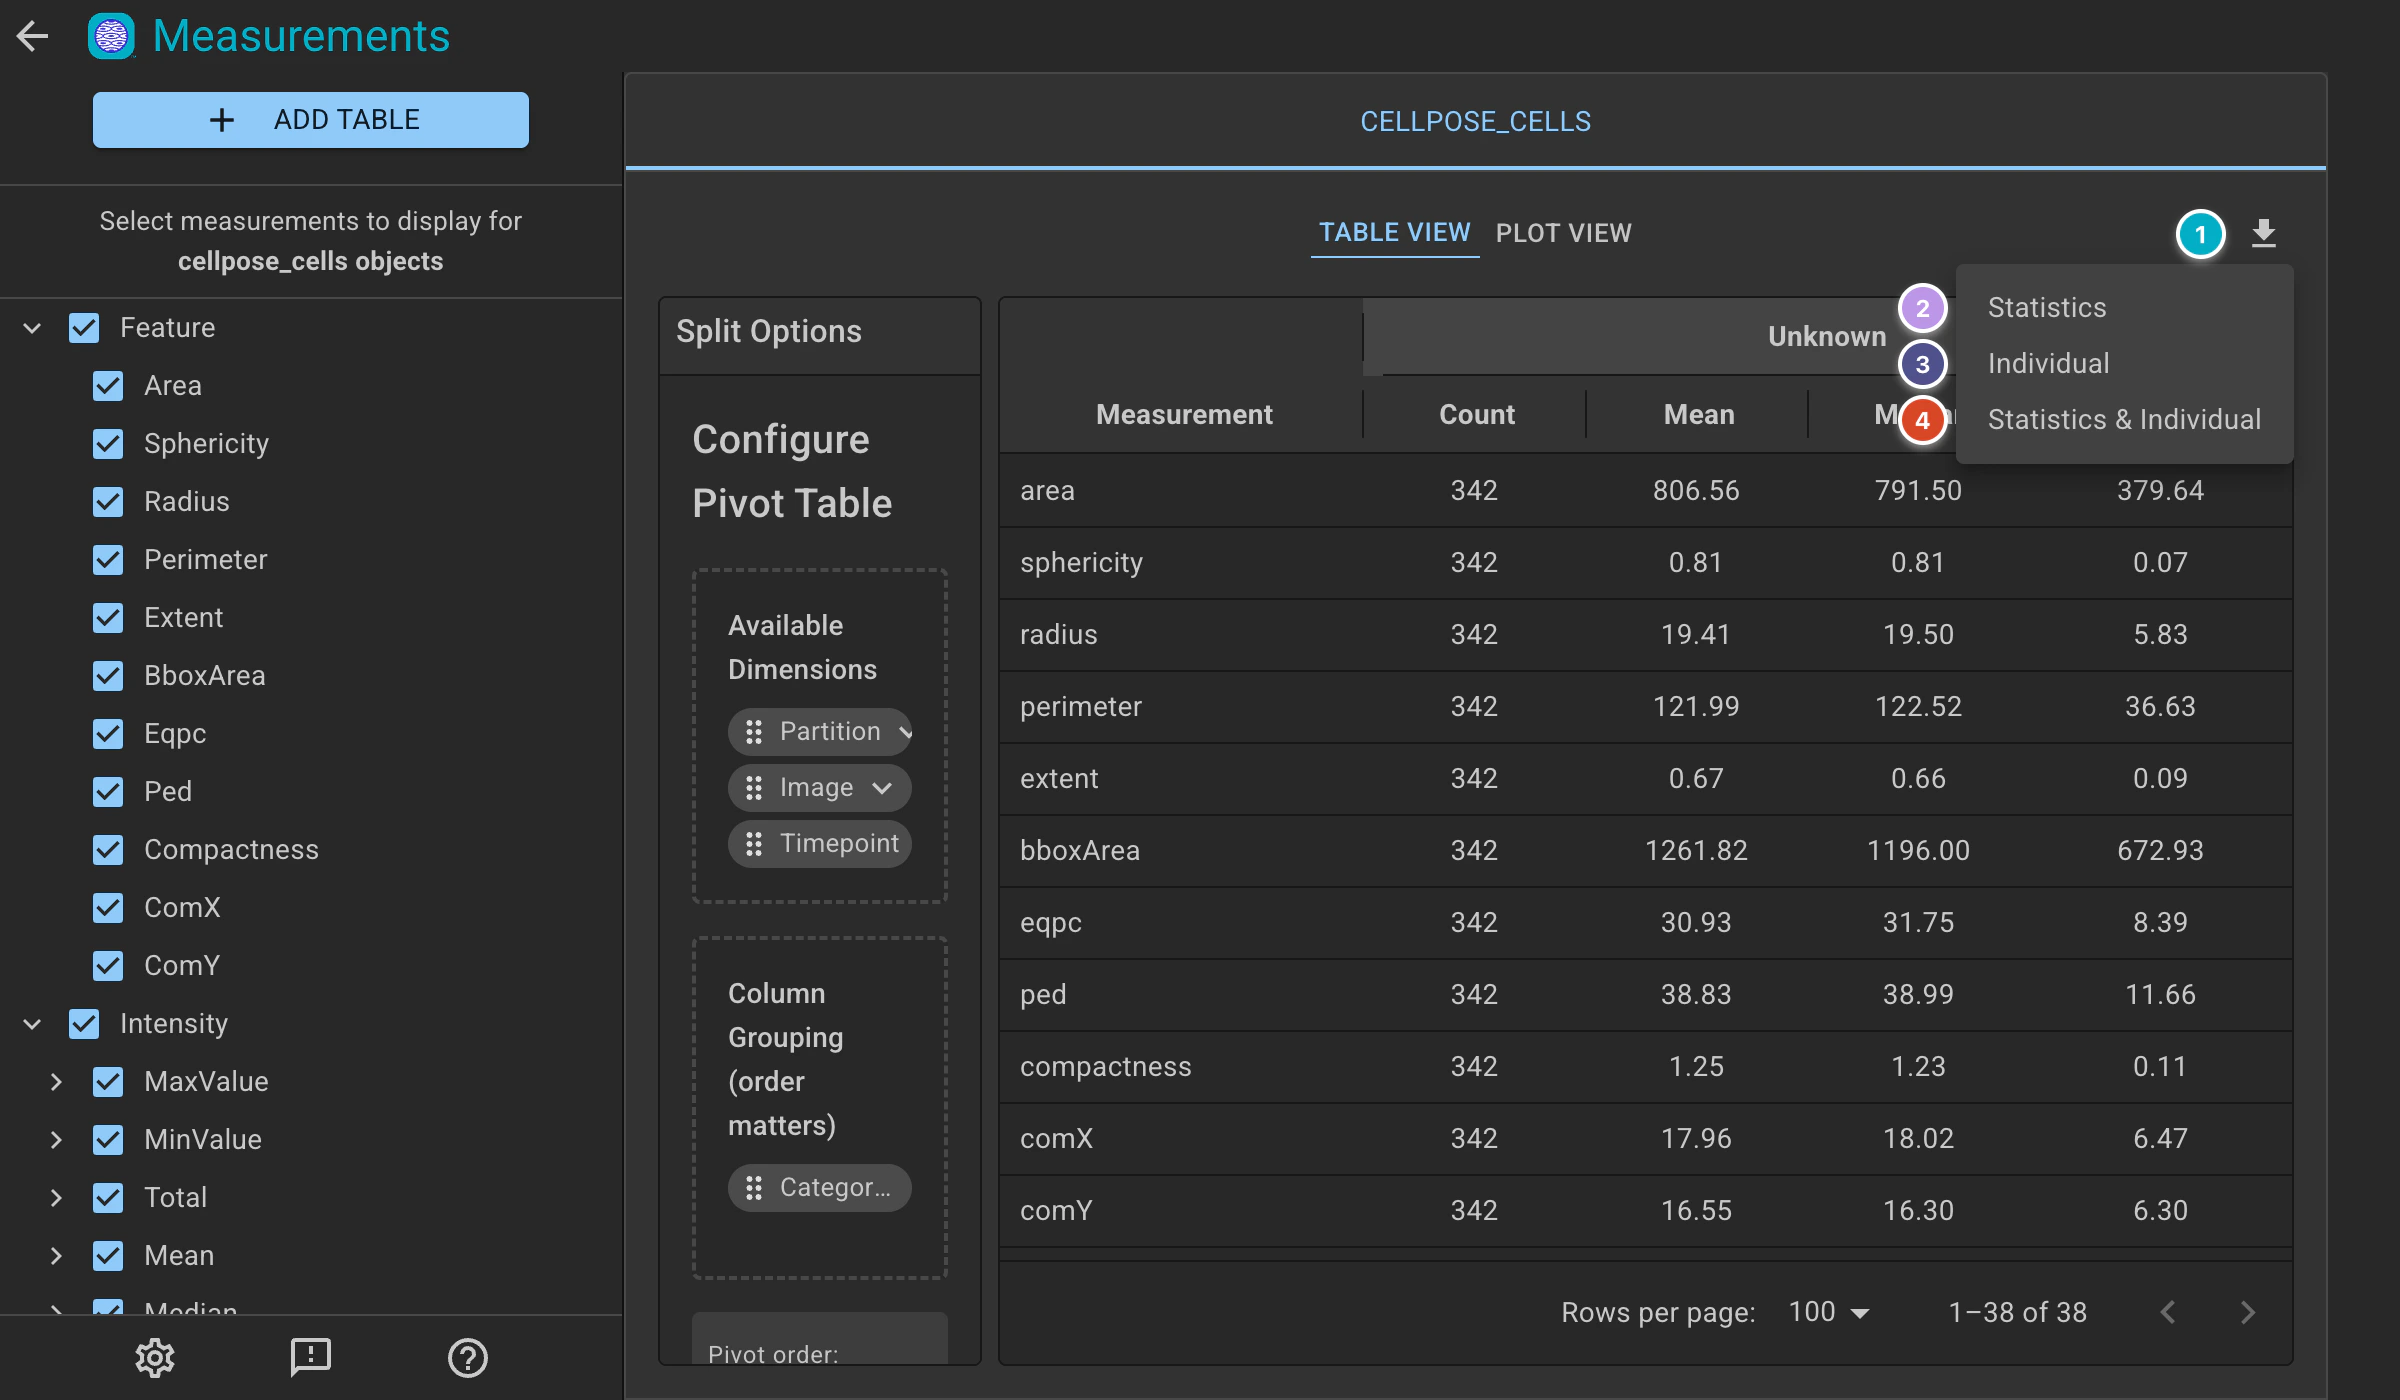
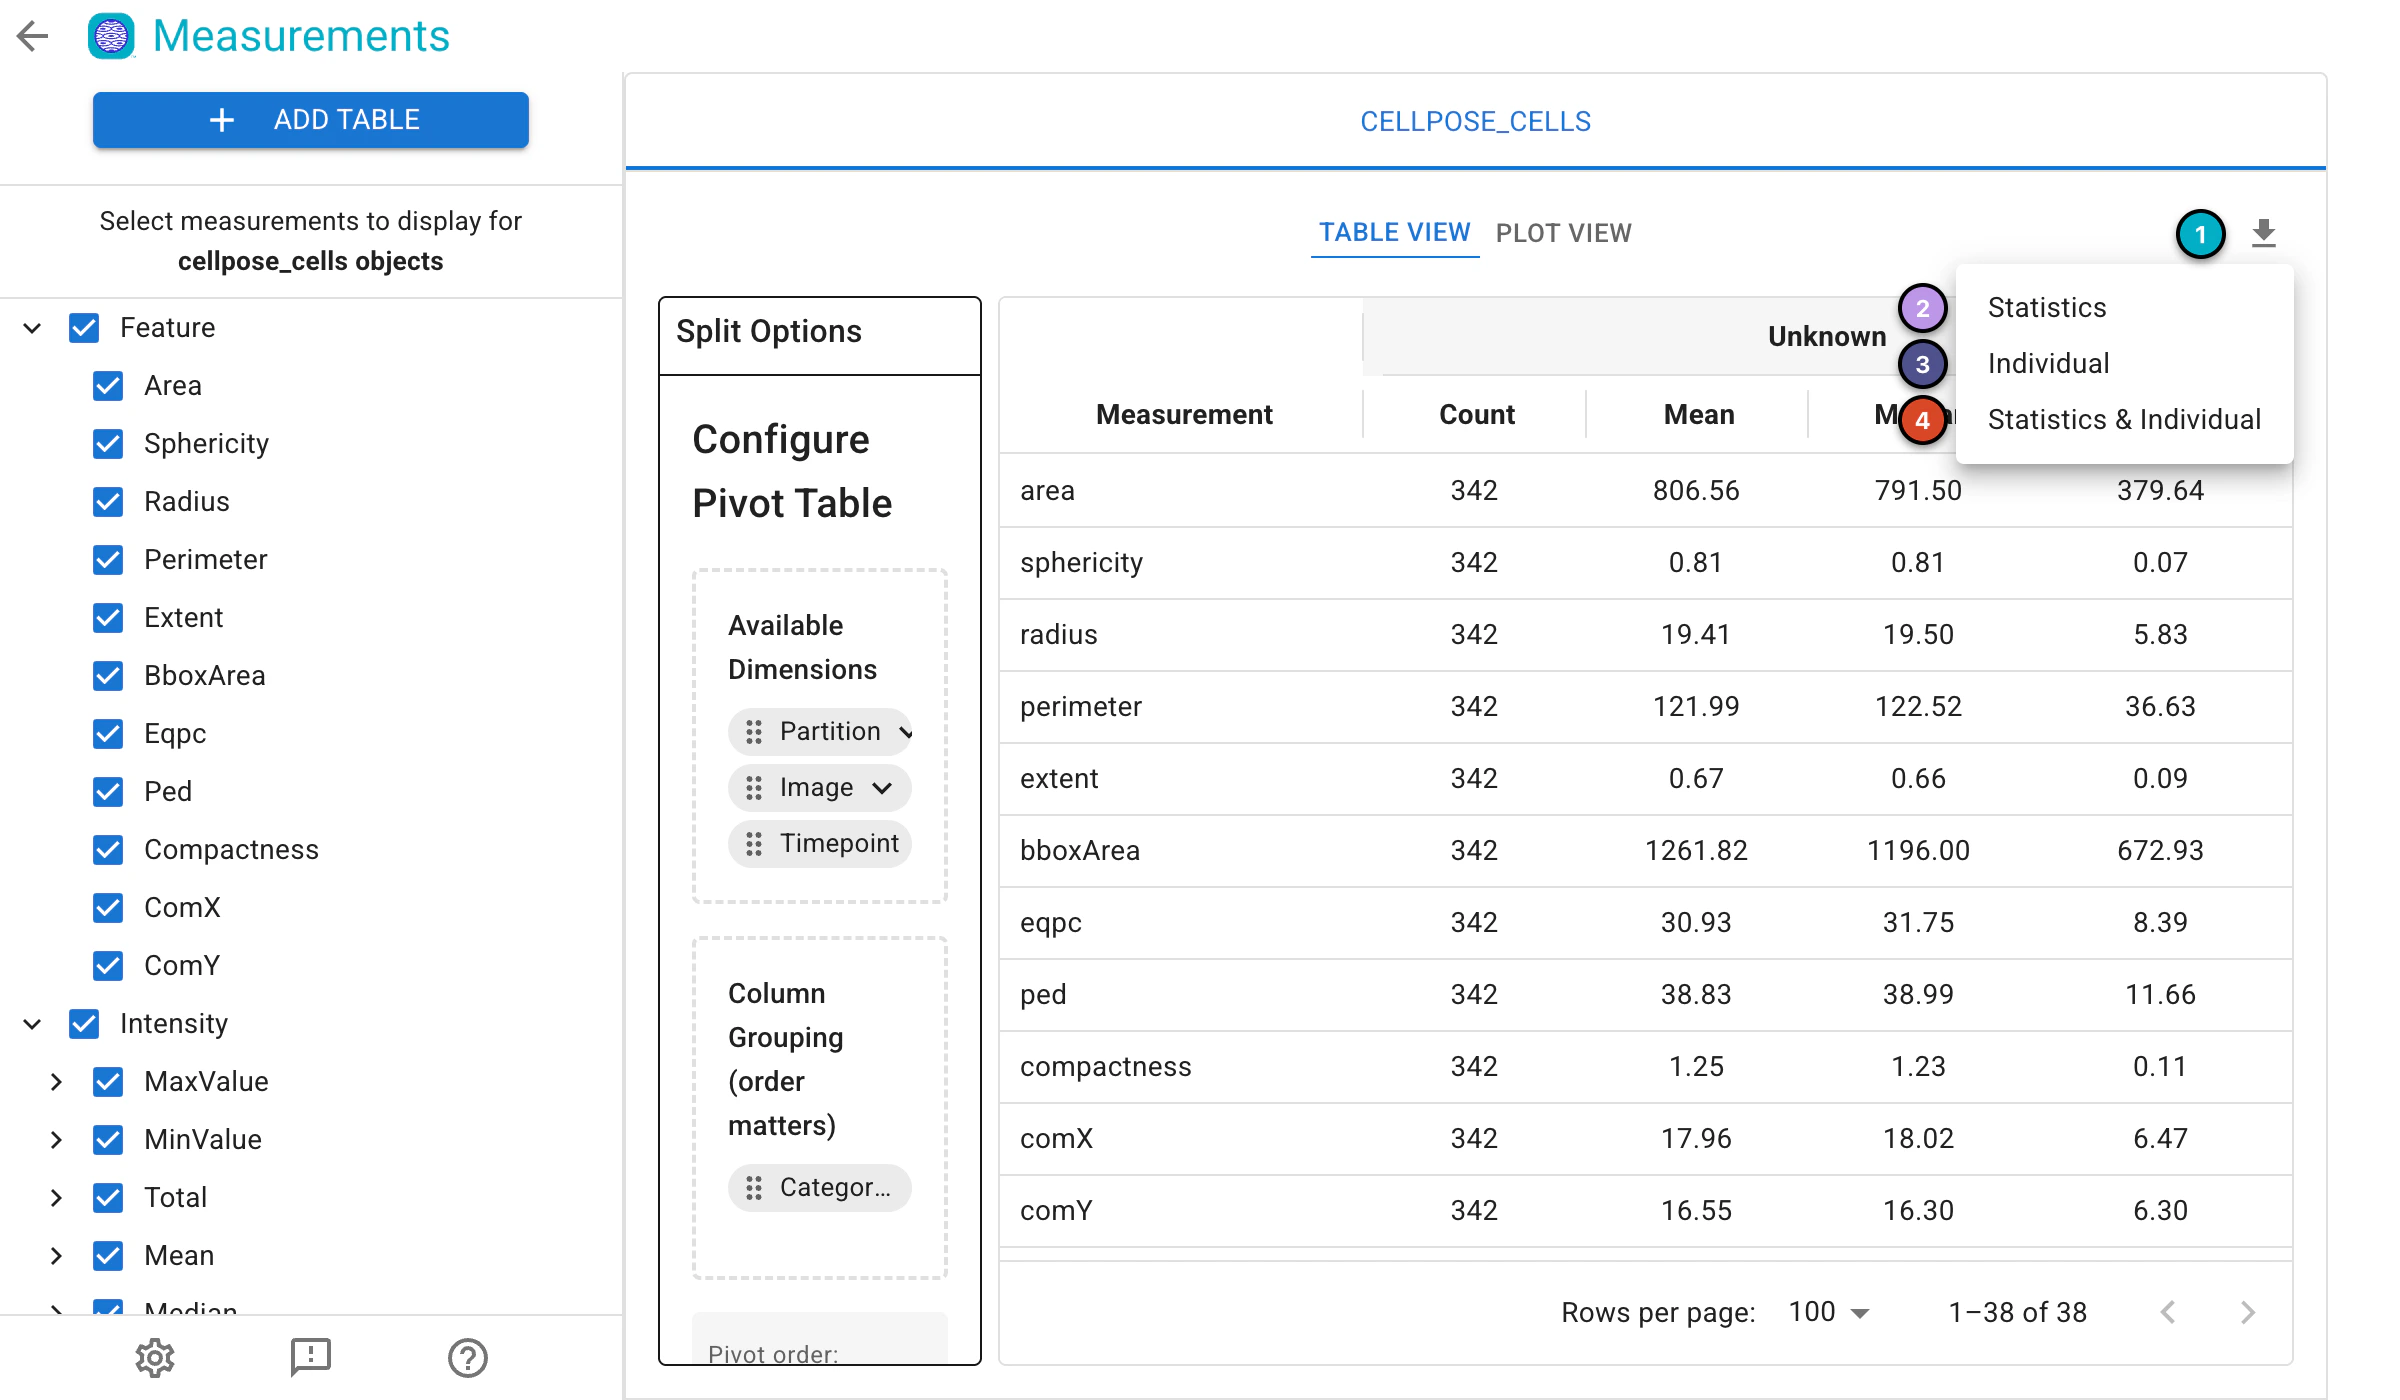
Piximi lets you export your data to outside programs.